Independent Financial Research & Analysis
Daily briefings, 7,000+ real-time charts, and macro insights from Dr. Ed Yardeni and his research team.
Latest Research
Recent insights from our research team
Oil, Financials & Slop
Equity investors, optimistic that the end of the Iran war is near, drove the S&P 500 to a record closing high yesterday. If only such optimism were reflected in oil prices. Jackie discusses the developments and expectations moving the two markets. … Also: The S&P Financials sector posted excellent Q1 results, but its ytd performance lags all other sectors’. Investors might be overlooking some tailwinds and overreacting to some headwinds. … And: Video disruptor YouTube is being disrupted by “AI slop” on its channels. So are its social media video platform peers. But prohibiting AI-generated content comes with a cost.
Read Full AnalysisThe Champagne Glass Is More Than Half Full
Happy days are here again! The S&P 500 and Nasdaq rose to record highs today, which just happens to be tax day. What's all the excitement about? The AI bubble hasn't burst, so far. Instead, hyperscaler stocks are leading the charge since the stock market bottomed on March 30 (chart). The private credit bubble may be losing some air, but it isn't bursting, while banks are still lending. Real GDP slowed during Q4-2025 and Q1-2026, but some of that was related to bad weather. As Chauncey Gardiner correctly predicted, "There will be growth in the Spring." In any event, S&P 500 earnings rose at a faster pace during the past two quarters to fresh record highs. And investors fear missing out on peace (FOMOOP) in the Middle East. Before the war started, we anticipated a stock market pullback because our two favorite Bull-Bear Ratios were too bullish (chart). At the end of the day on March 31, we said the market bottomed on March 30, partly because these two contrarian indicators had turned too bearish. They both rebounded over the past week, but remain relatively bearish, which is bullish, from a contrarian perspective. Nevertheless, it feels like the Roaring 2020s are back, given the strong V-shaped recovery in stock prices since March 30. So what could possibly go wrong? Obviously, the war could flare up again. Oil exports might remain blockaded in the Arabian Gulf, causing oil prices to rise again. Let's search for additional possible troubles in the economic reports of the past couple of days: I. Fed's Beige Book Is Beige The Fed's Beige Book was released today, covering data collected on or before April 6. The main message is that risks are skewed toward the inflation side of the Fed's dual mandate: (1) Labor markets held steady, with employment flat to slightly up in most districts, a marginal improvement from March's more mixed picture. Wages remained modest to moderate across all districts, with no acceleration or deceleration reported. (2) The most consequential shift from the March Beige Book is the energy price shock now hitting the economy. Higher energy costs are adding to residual tariff pressures, and an acceleration in input costs was universal across all districts. Selling price growth is lagging input cost increases, compressing margins. The short-term inflation picture has clearly worsened. The Beige Book is broadly consistent with our view. The economy remains in good shape, but inflation risks have intensified. This supports our conviction that the Fed is unlikely to cut rates again this year. II. Bankers Are Upbeat Major US banks kicked off the Q1 earnings season this week. Their CEOs' commentary was uniformly upbeat about the US economy in Q1. Here is what they had to say, in brief: (1) JPMorgan Chase. CEO Jamie Dimon described a resilient consumer and active spending environment: "The US economy remained resilient in the quarter, with consumers still earning and spending and businesses still healthy." He also flagged fiscal stimulus, deregulation, AI-driven capital investment, and the Fed's asset purchases as tailwinds. (2) Goldman Sachs. CEO David Solomon pointed to a constructive soft-landing scenario, with economic activity holding up and credit stress remaining limited. (3) Citigroup. CEO Jane Fraser called it an "exceptionally strong start" to 2026, with management highlighting a "constructive macroeconomic environment." (4) Bank of America. CEO Brian Moynihan cited healthy client activity, solid consumer spending, and stable asset quality as evidence of a resilient US economy. A resilient labor market, as indicated by low initial jobless claims, continues to support consumer spending. III. NFIB Employment Indexes The March NFIB survey of small business owners was released yesterday. It suggests that job openings may be bottoming (chart). Hiring intentions have moderated to their long-run average. These readings are consistent with our view that the labor market remains in good shape, with supply and demand roughly in balance. IV. Retail Sales The Redbook Retail Sales Index continues to run hot. During the week of April 10, it rose 7.0% y/y, well above the 2025 full-year average of 5.8% (chart). Redbook has now increased by more than 6% y/y for 12 consecutive weeks, the longest such streak since November 2022. The four-week moving average climbed to 7.1%, its highest since January 2023. The resilience of consumer spending is fully consistent with our upbeat economic outlook. Importantly, Redbook excludes gas station sales. V. Tax Refunds Just at the Right Time Thanks to the 2025 One Big Beautiful Bill Act, the 2026 tax filing season is delivering a timely boost to consumers' purchasing power. Year-to-date tax refunds through the week ending March 27 are up 13.6% y/y, and the average refund is up 11.1% y/y. The larger refunds will help cushion the blow from higher gasoline prices. Gasoline prices would need to stay above $4 per gallon for quite some time to fully offset the refund tailwind. VI. Consumer Sentiment April's preliminary Consumer Sentiment Index plunged to a record low, driven by mounting fears over rising energy prices and the Middle East conflict. The headline index dropped 10.7% m/m to 47.6, with both current conditions and expectations posting double-digit monthly declines. Short-term inflation expectations surged a full percentage point m/m to 4.8%, the highest since August 2025 (chart). If the post-pandemic period has taught us anything, it's that consumer confidence surveys are a poor leading indicator of actual spending.
Read Full AnalysisOn IMF’s War Scenarios, China’s EVs & US Earnings Revisions
The IMF’s just released World Economic Outlook analyzes the impacts of war on economies based on decades of data. Melissa has mined its findings for insights to investors trying to see through the fog of war. Chief among them: The hit to US GDP growth may be negligible. … Also: William discusses the sales windfall Chinese EV makers are enjoying as a result of the energy shock. … And: Joe’s analysis of analysts’ net earnings revisions reveals that S&P 500 sectors tied to the recently outperforming Magnificent-7 have been the target of estimate cutting, while the reverse is the case for the long-time lagging sectors.
Read Full AnalysisOur Research Library
19 years of daily research, charts, and analysis
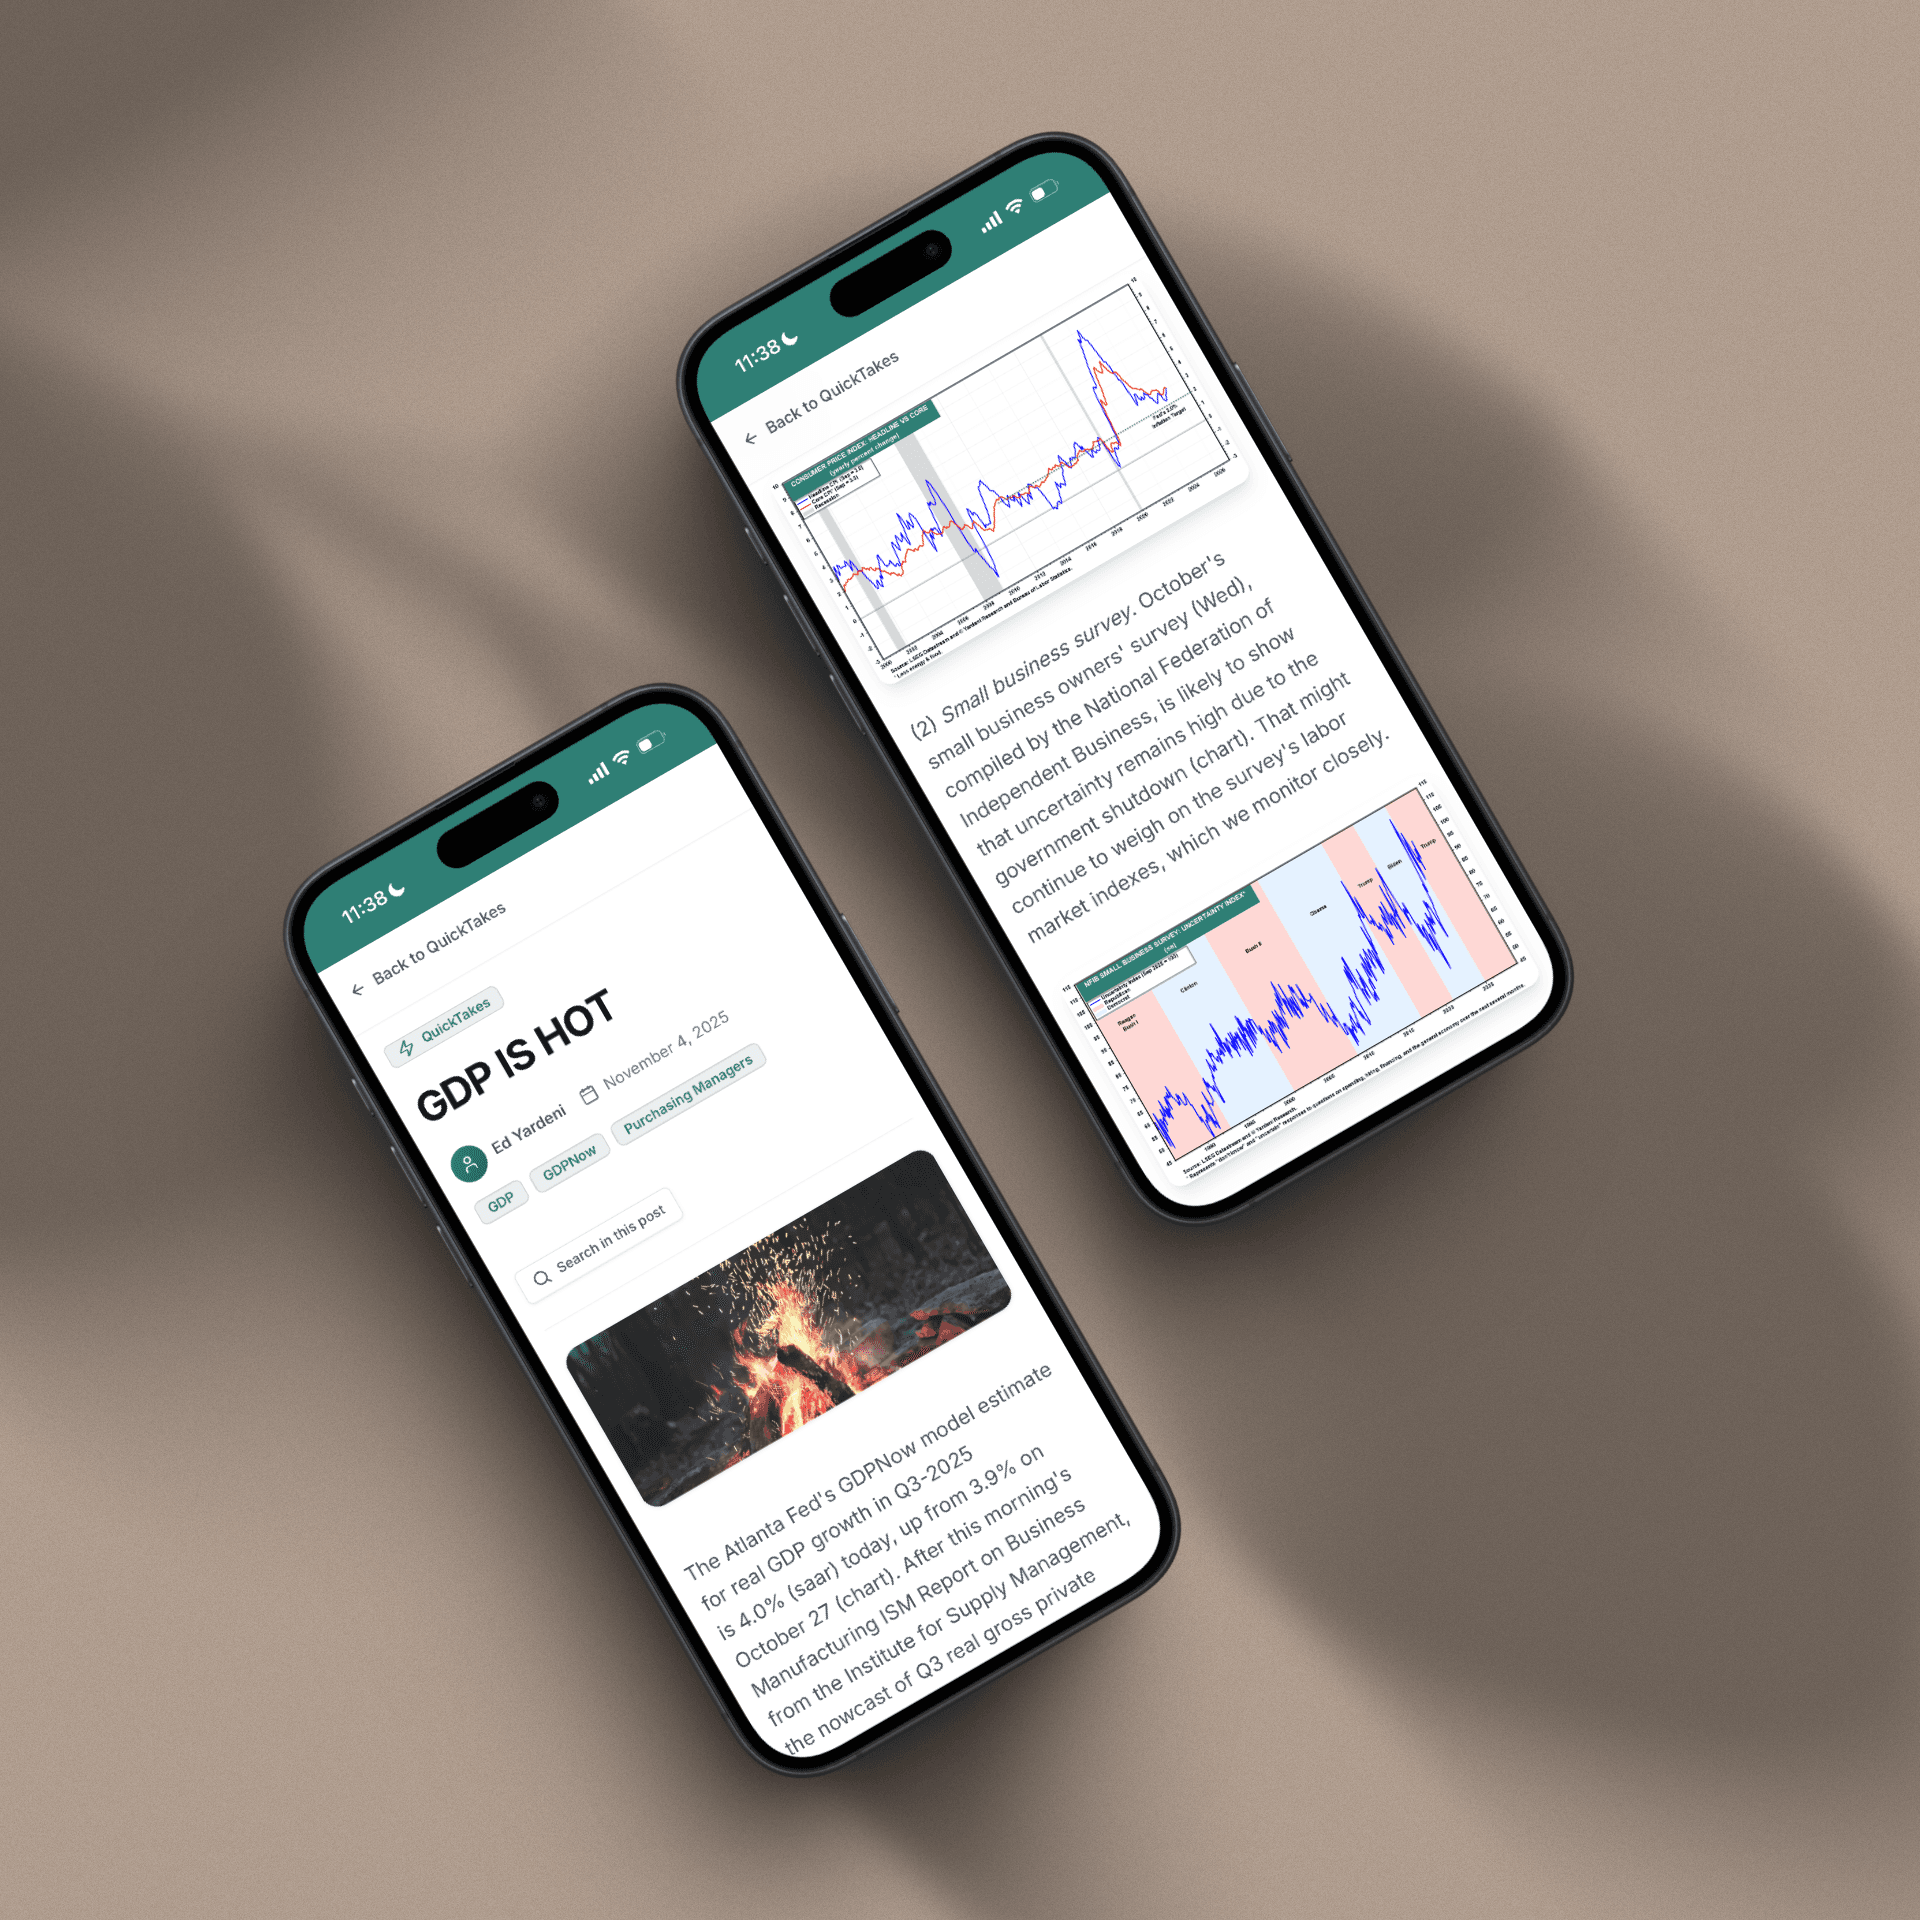
QuickTakes Topics
Timely commentary covering the most important market themes
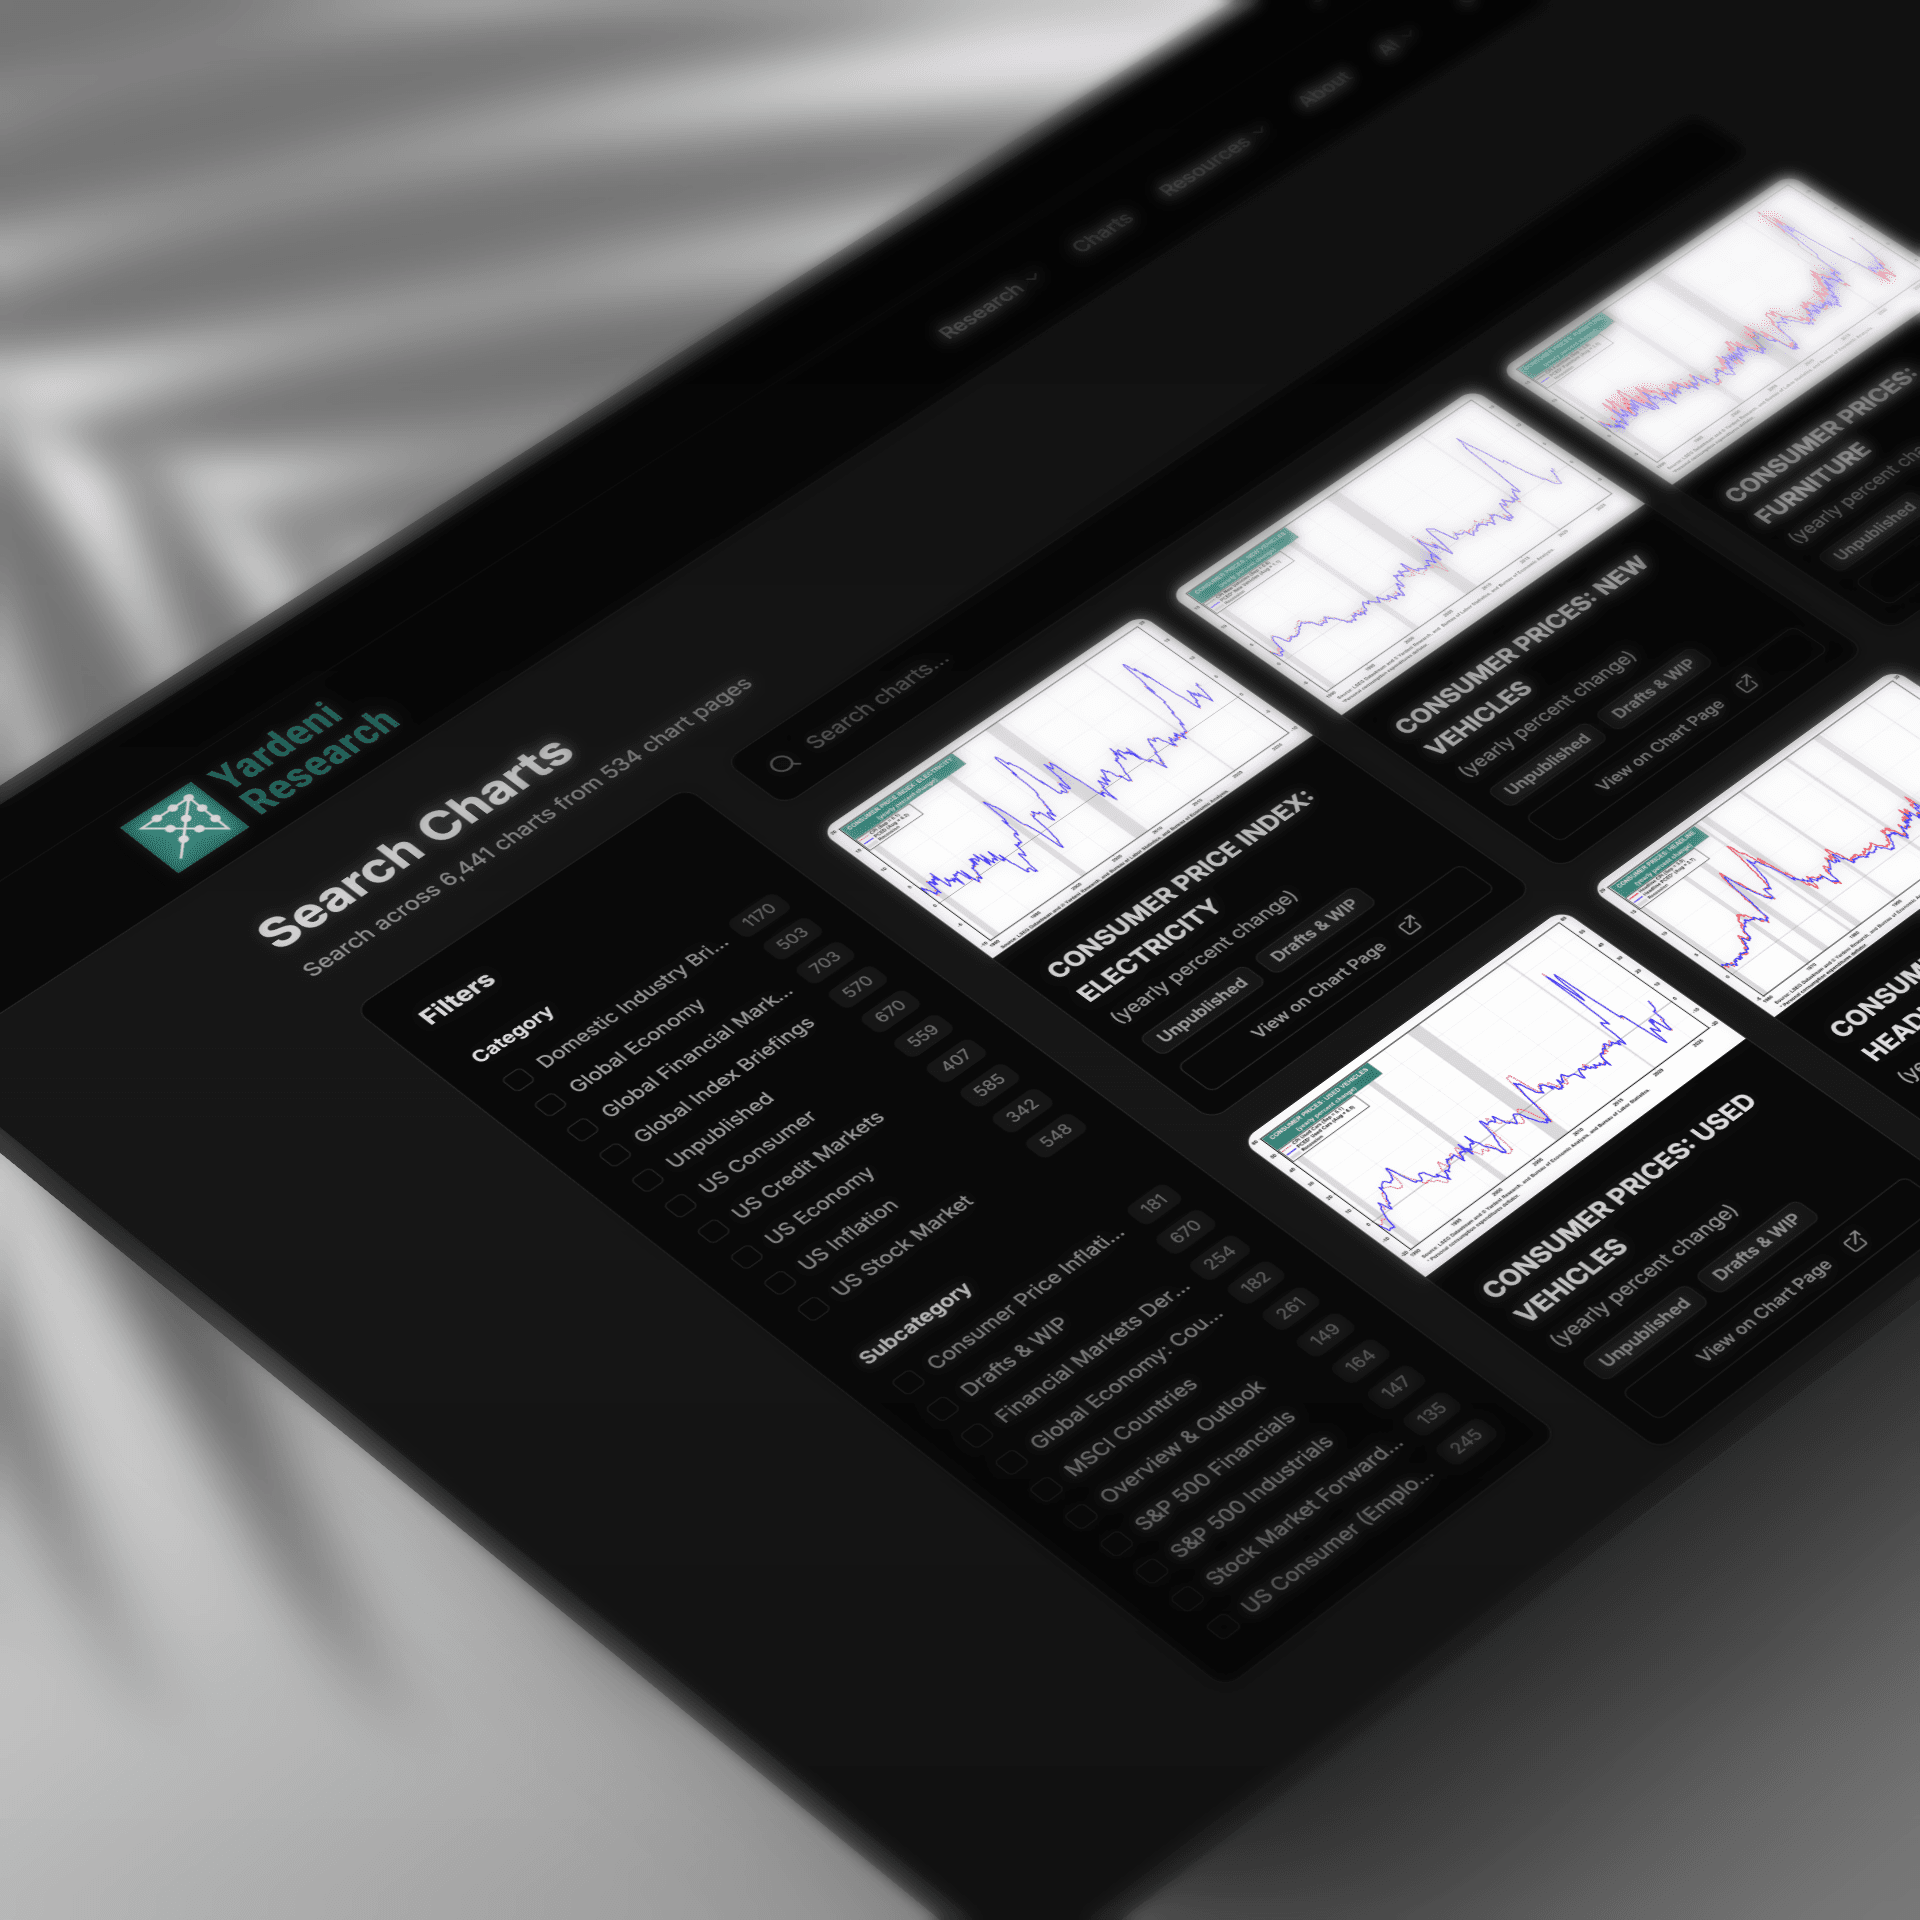
Find Any Chart in Seconds
Search across 7,044+ real-time charts with instant visual previews
MSCI EARNINGS PER SHARE: EMERGING MARKETS ASIA
ALTRIA: FORWARD P/E
TARGET: STOCK PRICE (TGT)
ALTRIA: STOCK PRICE INDEX, EARNINGS & P/E
Sample charts from our collection of 7,044+ visualizations
Research Tools
Interactive dashboards for tracking economic conditions and market trends
Beige Book Monitor
Fed economic conditions across 12 districts with traffic-light signals.
FOMC Policy Meter
Dovish-to-hawkish policy stance tracker across FOMC meetings.
FOMC Minutes Monitor
Hawk/dove signal extraction across 10 economic themes.
FOMC SEP Monitor
Fed projections and dot plot distributions across meetings.
Private Credit Monitor
Auto-updating chronology of the private credit liquidity crisis.
Release Calendar
Major publications from the Fed, ECB, IMF, and 12 global institutions.
Try Yardeni Research free for four weeks.
Full access to everything we publish. No credit card, no obligation.