
Independent Financial Research & Analysis
Daily briefings, 7,700+ real-time charts, and macro insights from Dr. Ed Yardeni and his research team.

Research
Latest Research
Recent insights from our research team
US MARKET CALL: Yes, AI Is Too Big To Fail
I. Bonds We've all been suffering from AI fatigue for a while. The daily news about it has been head-spinning. We've been warned that AI is a bubble that will burst, just as the late-1990s tech bubble led to the Tech Wreck in the early 2000s. Analogies to the credit excesses of the Great Financial Crisis have also been proffered. Last week's rout in AI-related stocks convinced the naysayers that the AI bubble is bursting, just as they’ve long predicted it would. Our happier spin is that the Bond Vigilantes are now doing a good job of regulating and allocating capital to the AI ecosystem. Credit-quality spreads are widening to reflect the riskiness of the bonds issued by some of the dodgier AI-related borrowers like CoreWeave and Oracle. The rapidly rising cost of credit for such borrowers should deflate the AI bubble without bursting it. If some AI-related credits do blow up, the Godfathers of the AI mafia (along with their protectors in the government) will clean up the mess. As in "The Godfather II," Michael Corleone has too much at stake to let his brother Fredo screw up the family business. Meanwhile, the rout in the AI corporate bond market has triggered a flight to quality and safety that has stopped the rout in the US Treasury bond market (chart). This confirms our thesis that the recent rise in US bond yields mostly reflects better-than-expected economic growth. Tougher credit conditions in the AI corporate bond market should curb some of the AI excesses. However, we doubt this will trigger an economy-wide credit crunch or a recession. We aren't convinced that it will slow capital spending much, since labor and materials shortages, along with public NIMBY pushback, have already slowed the pace of data center construction. II. S&P Earnings The big banks reported mixed but solid overall Q3 earnings last week. On average, they met banking industry analysts' expectations. Last week, the consensus EPS for all analysts covering S&P 500 companies edged up to $365.70 this year, $424.19 next year, and $492.62 in 2028 (chart). Those are extremely bullish expectations considering that we are still forecasting $500 in 2030! If the analysts are right, the S&P 500 could rise to 10,000 by the end of next year, assuming a forward P/E of 20.0-21.0. For now, we are sticking with 10,000 by the end of the Roaring 2020s, i.e., at the end of 2029. Last week, Q3's consensus EPS growth rate remained at 24.0% y/y, while the Q4 estimate rose to 29.8% (chart). We've been among the most bullish investment strategists on the Street, but analysts are still ahead of us. The S&P 500, S&P 400, and S&P 600 continued to rise to record highs last week (chart). III. Stock Valuation The recent stock market selloff has been driven by falling forward P/Es even as forward earnings have been rising to record highs (chart). The former are nearing the troughs they made during last year's "Liberation Day" lows. Since roughly mid-2025, rising FEMO (fabulous earnings momentum) has more than offset falling FOMO (fear of missing out) (chart). Since October 6, the reverse has been true: Falling FOMO is outpacing the rise in FEMO. IV. Performance The stock market had a tough week last week. Leading the 1.95% pullback was MAGS (down 3.89%), while XMAGS fell 1.38% (chart). The Russell 2000 fell 2.4%, while the Nasdaq fell 4.5%. The DJIA rose 0.67% for the week. The Impressive 493 is still outperforming the Magnificent-7 on a year-to-date basis, with a gain of 14.1% versus 10.2%. V. Sentiment The market letter writers have been more bullish than retail investors lately (chart). Odds are they will both be a bit more pessimistic this week. Only 47.4% of the S&P 500 are trading above their 200-day moving averages (chart). VI. Commodities Aluminum prices are falling after matching their 2022 peak. This suggests that supply-chain disruptions attributable to Gulf War III are receding, as they had done after Russia invaded Ukraine (chart). Copper prices remained near their recent record high last week despite chatter that tightening credit conditions could slow the AI buildout and weigh on overall GDP growth (chart). The outlook for higher-for-longer diesel prices offers no relief (chart). We aren't giving up on gold yet. The current correction resembles previous ones that occurred in the middle of significant gold bull runs (chart). This time, rising interest rates have been weighing on the metal's price. However, significant buying by the People's Bank of China and other central banks isn't interest-rate sensitive. We are still aiming for a gold price of $5,000 an ounce by the end of this year or early next year.
AI Scare Raises Growth Fears and Lowers Bond Yields
I. Treasury Yields US Treasury yields fell sharply today, extending Wednesday's retreat from intraday highs. The 10-year yield dropped 9bps to 5.10%, while the 30-year fell 10bps to 5.43% (chart). Even the 2-year yield declined slightly to 4.77% (chart). Remarkably, this broad-based decline occurred despite two hotter-than-expected inflation reports. Normally, such surprises would push Treasury yields higher as investors priced in a more hawkish Fed. So, what's going on? We think the bond market is focusing on the sustainability of the AI investment boom. That issue came to the fore this week as CoreWeave's bonds plunged below 80 cents on the dollar and debt financing major data center projects also tumbled. A new Gartner report estimates AI data center operators will need $8.5 trillion in revenues through 2030 to cover costs and earn healthy returns, versus projected revenues of "just" $3.6 trillion. Why does this matter? The AI buildout has become a major engine of US economic growth. But doubts about future returns are pushing up borrowing costs, potentially constraining access to capital and ultimately slowing investment spending. As a result, investors may be lowering their economic growth expectations amid concerns that the AI boom could slow, pushing Treasury yields lower. This reinforces our longstanding view that the earlier surge in Treasury yields largely reflected stronger-than-expected nominal GDP growth (chart). We are nowhere near ready to write off the AI investment boom. Demand for compute continues to outpace supply, while rising adoption should fuel further investment. Indeed, just five hyperscalers (Amazon, Alphabet, Meta, Microsoft, and Oracle) are expected to spend a combined $892 billion this year and $1.1 trillion next year. Their strong balance sheets and cash flow generation make their spending plans relatively insensitive to higher borrowing costs. While heavily indebted AI infrastructure providers may struggle, we expect the hyperscalers to keep spending and the Roaring 2020s to keep roaring. II. Inflation Let's take a closer look at September's hotter-than-expected PPI report and what it tells us about inflationary pressures in the pipeline. (1) PPI for final demand. September's PPI final demand surged 1.3% m/m, largely reflecting a 10.8% spike in energy prices. However, even excluding the volatile food, energy, and trade services components, producer prices still rose 0.5%, suggesting that inflationary pressures remain broad-based. On a y/y basis, core PPI final demand rose to 5.0%, with services and goods prices rising 5.0% and 5.2%, respectively (chart). (2) PPI for consumption. The PPI for personal consumption, a key input into the Fed’s preferred PCED inflation gauge, surged by 1.3% m/m in September (chart). Excluding food and energy, it was up 0.6%. Core PPI personal consumption rose to 4.6% y/y and remained well above both core PCED and core CPI inflation, suggesting that upside risks to consumer inflation remain elevated (chart). (3) Supercore inflation. The PPI supercore inflation rate rose to 4.6% y/y in September (chart). (4) Core PCED. With September CPI and PPI now in hand, most forecasters expect core PCED inflation to rise 0.3% m/m in September, which would lift the y/y rate from 3.0% to 3.1%. The Cleveland Fed’s Inflation Nowcasting model projects 0.28% m/m and 3.05% y/y, respectively. III. Booming Economy For now, the US economy shows no signs of slowing down. Consider the latest data points: (1) Jobless claims. Initial jobless claims edged up slightly to 199,000 in the week ended October 10, the fifth straight week below 200,000. That is the longest streak since 1969! Continuing claims declined to 1.71 million, dragging down the 4-week moving average to the lowest level since April 2023 (chart). (2) Retail sales. September retail sales rose 0.8% m/m, partly driven by a 6.4% surge in gasoline station sales amid elevated pump prices (chart). Still, eight of the 13 major categories posted gains. Sales at food services and drinking places, the only services category and a key discretionary spending indicator, jumped 1.1% m/m, their eighth consecutive monthly gain. They rose 7.0% y/y, the strongest increase since March 2023. (3) GDP. Reflecting today's retail sales report, the Atlanta Fed’s GDPNow model estimates Q3 real GDP growth at 3.6% (saar), unchanged from October 8 (chart). Consumer spending is projected to rise 3.6%. AI-related demand is boosting business equipment investment (17.6%), fixed business structures (7.0%), and intellectual property investment (6.6%). Final sales to private domestic purchasers are expected to grow 4.7%.
On Bank Earnings & Defending Data Centers
Investors have been worried about the major banks, particularly given fears that leveraged AI data center operators will cause a deterioration of corporate credit quality. But if a reckoning is coming, it’s a future concern. Life for the big banks is currently sweet. That’s Jackie’s takeaway from the stellar Q3 earnings reports of JP Morgan and Bank of America, which enjoyed expanding loan portfolios and net interest income last quarter. … Also: Amid all the spending hyperscalers are doing to build AI infrastructure, they may have ignored an important detail: How to protect data centers if they are attacked.
Archive
Our Research Library
19 years of daily research, charts, and analysis
Topics
QuickTakes Topics
Timely commentary covering the most important market themes
Charts
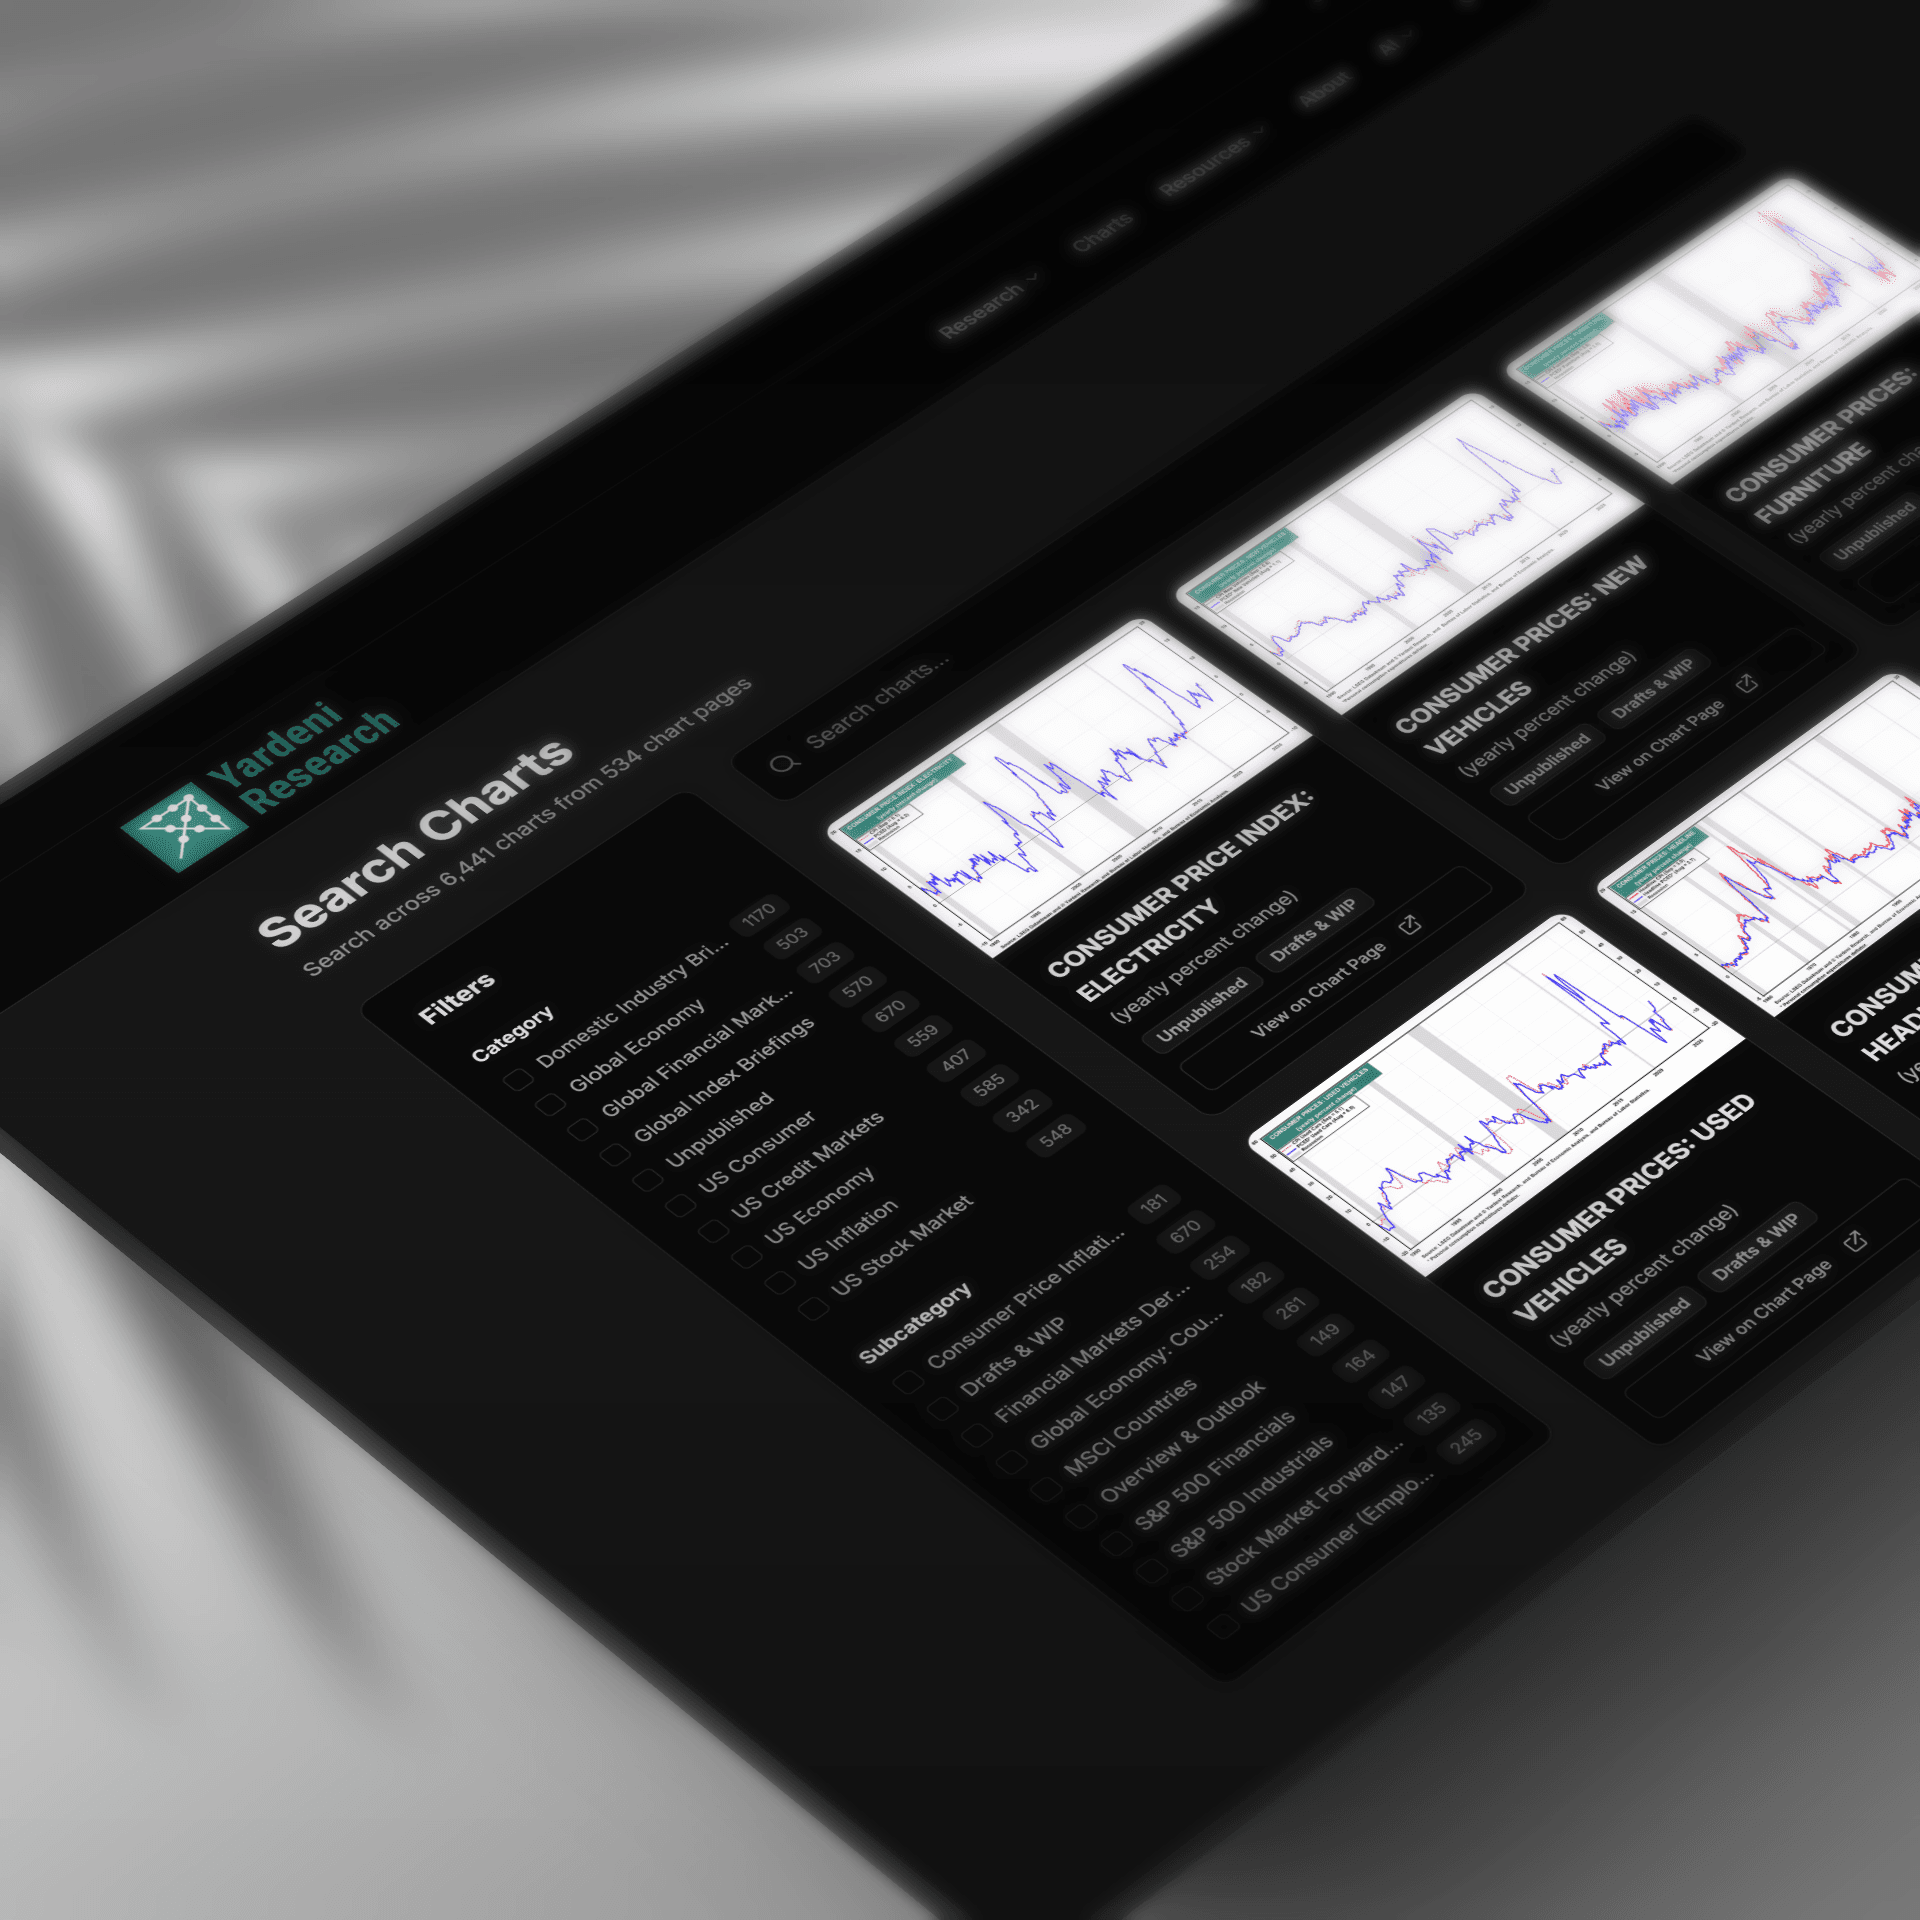
Find Any Chart in Seconds
Search across 7,748+ real-time charts with instant visual previews
S&P 500 TRANSACTION & PAYMENT PROCESSING SERVICES: STOCK PRICE INDEX
DELL TECHNOLOGIES: FORWARD OPERATING EARNINGS PER SHARE
WELLS FARGO: FORWARD REVENUES
S&P 500 INDUSTRIALS SECTOR & INDUSTRIES: ANNUAL EARNING GROWTH FORECAST
Sample charts from our collection of 7,748+ visualizations
Tools
Research Tools
Interactive dashboards for tracking economic conditions and market trends
Beige Book Monitor
Fed economic conditions across 12 districts with traffic-light signals.
FOMC Policy Meter
Dovish-to-hawkish policy stance tracker across FOMC meetings.
FOMC Minutes Monitor
Hawk/dove signal extraction across 10 economic themes.
FOMC SEP Monitor
Fed projections and dot plot distributions across meetings.
FOMC Statements
Every FOMC policy statement since 1997 — full text, rates, and voting records.
Private Credit Monitor
Auto-updating chronology of the private credit liquidity crisis.
Release Calendar
Major publications from the Fed, ECB, IMF, and 12 global institutions.
Try Yardeni Research free for four weeks.
Full access to everything we publish. No credit card, no obligation.