Independent Financial Research & Analysis
Daily briefings, 7,400+ real-time charts, and macro insights from Dr. Ed Yardeni and his research team.
Research
Latest Research
Recent insights from our research team
Employment Is Heating Up, But So Is Inflation
As we've been predicting in recent months, labor market conditions are improving, while inflationary pressures remain elevated. We expect the FOMC will shift to a tightening bias at the June meeting of the Fed's policy-setting committee and will probably hike the federal funds rate in July if current trends persist. Don't get us wrong, we expect inflationary pressures to ease later this year, assuming, as we do, that the price of crude oil will settle between $75-$85 a barrel once the war in the Middle East has been resolved, opening the Strait of Hormuz to free maritime passage again. Oil tankers are reportedly already passing through the strait if their owners pay Iran's "toll." We are also counting on productivity growth to keep a lid on unit labor costs inflation (ULC). So far, so good. Today's revisions for Q1 reduced the growth rates of both productivity and hourly compensation. Productivity is still up nicely at 2.8% y/y, while hourly compensation increased 3.3%. So ULC inflation is now down to just 0.5% y/y during Q1 (chart). This measure of the underlying inflation rate in the labor market is providing a strong disinflationary offset to the inflationary energy shock from the war. ULC inflation rose sharply during 2021 and 2022. The FOMC should pivot toward tightening monetary policy to avert a renewed wage-price spiral and to cool speculative excesses in the stock market. Now, let's review the multiple data points that confirm the labor market and economy are doing well: (1) ADP. The US private sector added 122,000 jobs in May, the strongest monthly pace since January 2025, according to ADP. The gain was broadly based, with eight of the 10 sectors posting gains (chart). ADP chief economist Nela Richardson noted that "hiring was more broadly based in May than we have seen in the last few years," adding that "the labor market continues to show sustained momentum going into the summer hiring season." (2) Revelio Labs. The ADP reading is corroborated by Revelio Labs, which reported that the US economy added 123,700 jobs in May, the strongest monthly pace since July 2024 (chart). (3) Challenger Report. US employers announced 97,006 job cuts in May. However, this series is inherently volatile and remains relatively low (chart). (4) Initial Claims. Initial unemployment insurance claims rose slightly to 225,000 last week (which included Memorial Day) but remains low and consistent with very subdued layoff activity (chart). Continuing claims ticked down to 1,777,000, remaining near its lowest level since January 2024. (5) ISM PMIs. The ISM NM-PMI edged up to 54.5 in May, its 23rd consecutive month of expansion (chart). The ISM M-PMI rose to 54.0 in May, its fifth consecutive month of expansion and the highest reading since 2022. Both sectors of the economy are now expanding simultaneously at solid paces. The prices-paid component of the NM-PMI survey rose to 71.3 in May, the highest since August 2022. The prices-paid index for the M-PMI was even higher at 82.1 last month (chart). Both confirm that inflationary pressures remain significant due to the energy shock, supply chain disruptions, and tariffs. (6) Weekly Economic Index. The Weekly Economic Index, which aggregates 10 high-frequency daily and weekly data series to track real-time US economic activity, rose to 3.2% for the week of May 29, its highest reading since August 2022. This suggests that real GDP is growing around 3% y/y. (7) Beige Book. The Fed's Beige Book, covering data collected on or just before May 27, confirms that inflation risks are higher than unemployment risks. Economic activity. Ten of 12 Fed district banks reported slight to moderate economic growth, up from eight in April. Nine of 12 districts reported modest to strong manufacturing growth, a clear improvement from April's mixed picture. Consumer spending was bifurcated, with higher-income households resilient and middle- and lower-income households showing signs of stress. Modest to moderate wage growth persisted across all districts, and 11 districts reported little to no change in employment. Inflation. Multiple districts reported rapid price increases, with the energy shock now the primary driver, generating spillovers into shipping, food, fertilizer, and packaging costs. The Beige Book is consistent with our view that the economy remains in solid shape, but inflation risks have increased for the next few months.
On Consumer Strength & Bitcoin Weakness
Consumer spending has remained resilient in the face of higher gas prices and inflation generally, thanks much to a resilient job market. Jackie recaps recent employment data and discusses Q1 consumer behavior as described by the top brass of three retailers serving different customer niches. … In our Disruptive Technologies segment, a look at the sagging value of bitcoin and sagging investor confidence in Strategy, a small company that’s a play on the cryptocurrency. Investors were shaken by the company’s recent bitcoin asset sales and wonder about an encore.
June Swoon?
So far, the S&P 500 bottomed this year on March 30 in response to the latest Gulf War. Since then, Fabulous Earnings Momentum (FEMO) during the Q1 earnings reporting season fueled a remarkable 19.1% rally in the index, led by an amazing 44.5% increase in the S&P 500 Information Technology sector (chart). Yesterday, we raised the caution flag, suggesting a possible pullback over the next few weeks. We are concerned about warnings from Exxon and Chevron executives that global crude oil inventories are so low that the crude oil price could spike to $150 a barrel unless the war ends very soon. We also expect the FOMC to pivot from an easing bias to a tightening bias at the committee's next meeting later this month. We then expect the FOMC to raise the federal funds rate by 25bps in July. The financial markets are also expecting a rate hike, but late this year. The SpaceX IPO should be a big hit because everyone knows Wall Street has bent the rules to ensure the stock price soars initially. However, that could cause lots of volatility if a price spike triggers a wave of profit-taking. In any event, we view any pullback as a buying opportunity and maintain our 8250 target for the S&P 500 by year-end. Might there be more FEMO ahead? Yes, but it might already be discounted by the market, making it vulnerable to even slight disappointments. A case in point is Broadcom's 13% after-hours sell-off today, when the company's solid earnings report was somewhat weaker than expected. S&P 500 forward earnings is up 26.6% y/y through May. That's as good as FEMO gets historically, with the exception of post-recession recoveries (chart). Meanwhile, it is puzzling that oil prices remain around $100 a barrel, despite warnings from oil industry leaders of much higher prices ahead (chart). Apparently, oil tanker owners are paying Iran a "toll" to allow them safe passage out of the Persian Gulf. Russia is selling lots of oil to China and India. The US has also been exporting more crude oil an petroleum products in recent weeks (chart). The 2-year US Treasury yield is a good leading indicator of the federal funds rate (FFR). It is up to 4.08%, exceeding the current 3.50%-3.75% FFR range (chart). It is anticipating a Fed rate hike in response to recent hotter-than-expected inflation reports and stronger-than-expected employment indicators. Another concern is that Q1's FEMO seems to have stimulated irrational exuberance about the long-term earnings growth (LTEG) prospects of the S&P 500 (chart). Analysts' heady expectations for LTEG are mirrored in the Nasdaq's vertical ascent (chart) ... ... momentum ETFs (chart) ... ... semiconductor ETFs (chart) ... ... quantum computing stock prices (chart) .... ... emerging market ETFs bolstered by AI bets on Taiwan and South Korea (chart). Then again, some of the froth seems to be coming out of the Magnificent-7 (chart). Last but not least, our two favorite bull/bear ratios remain relatively subdued, suggesting that any pullback should be modest (chart).
Archive
Our Research Library
19 years of daily research, charts, and analysis
Topics
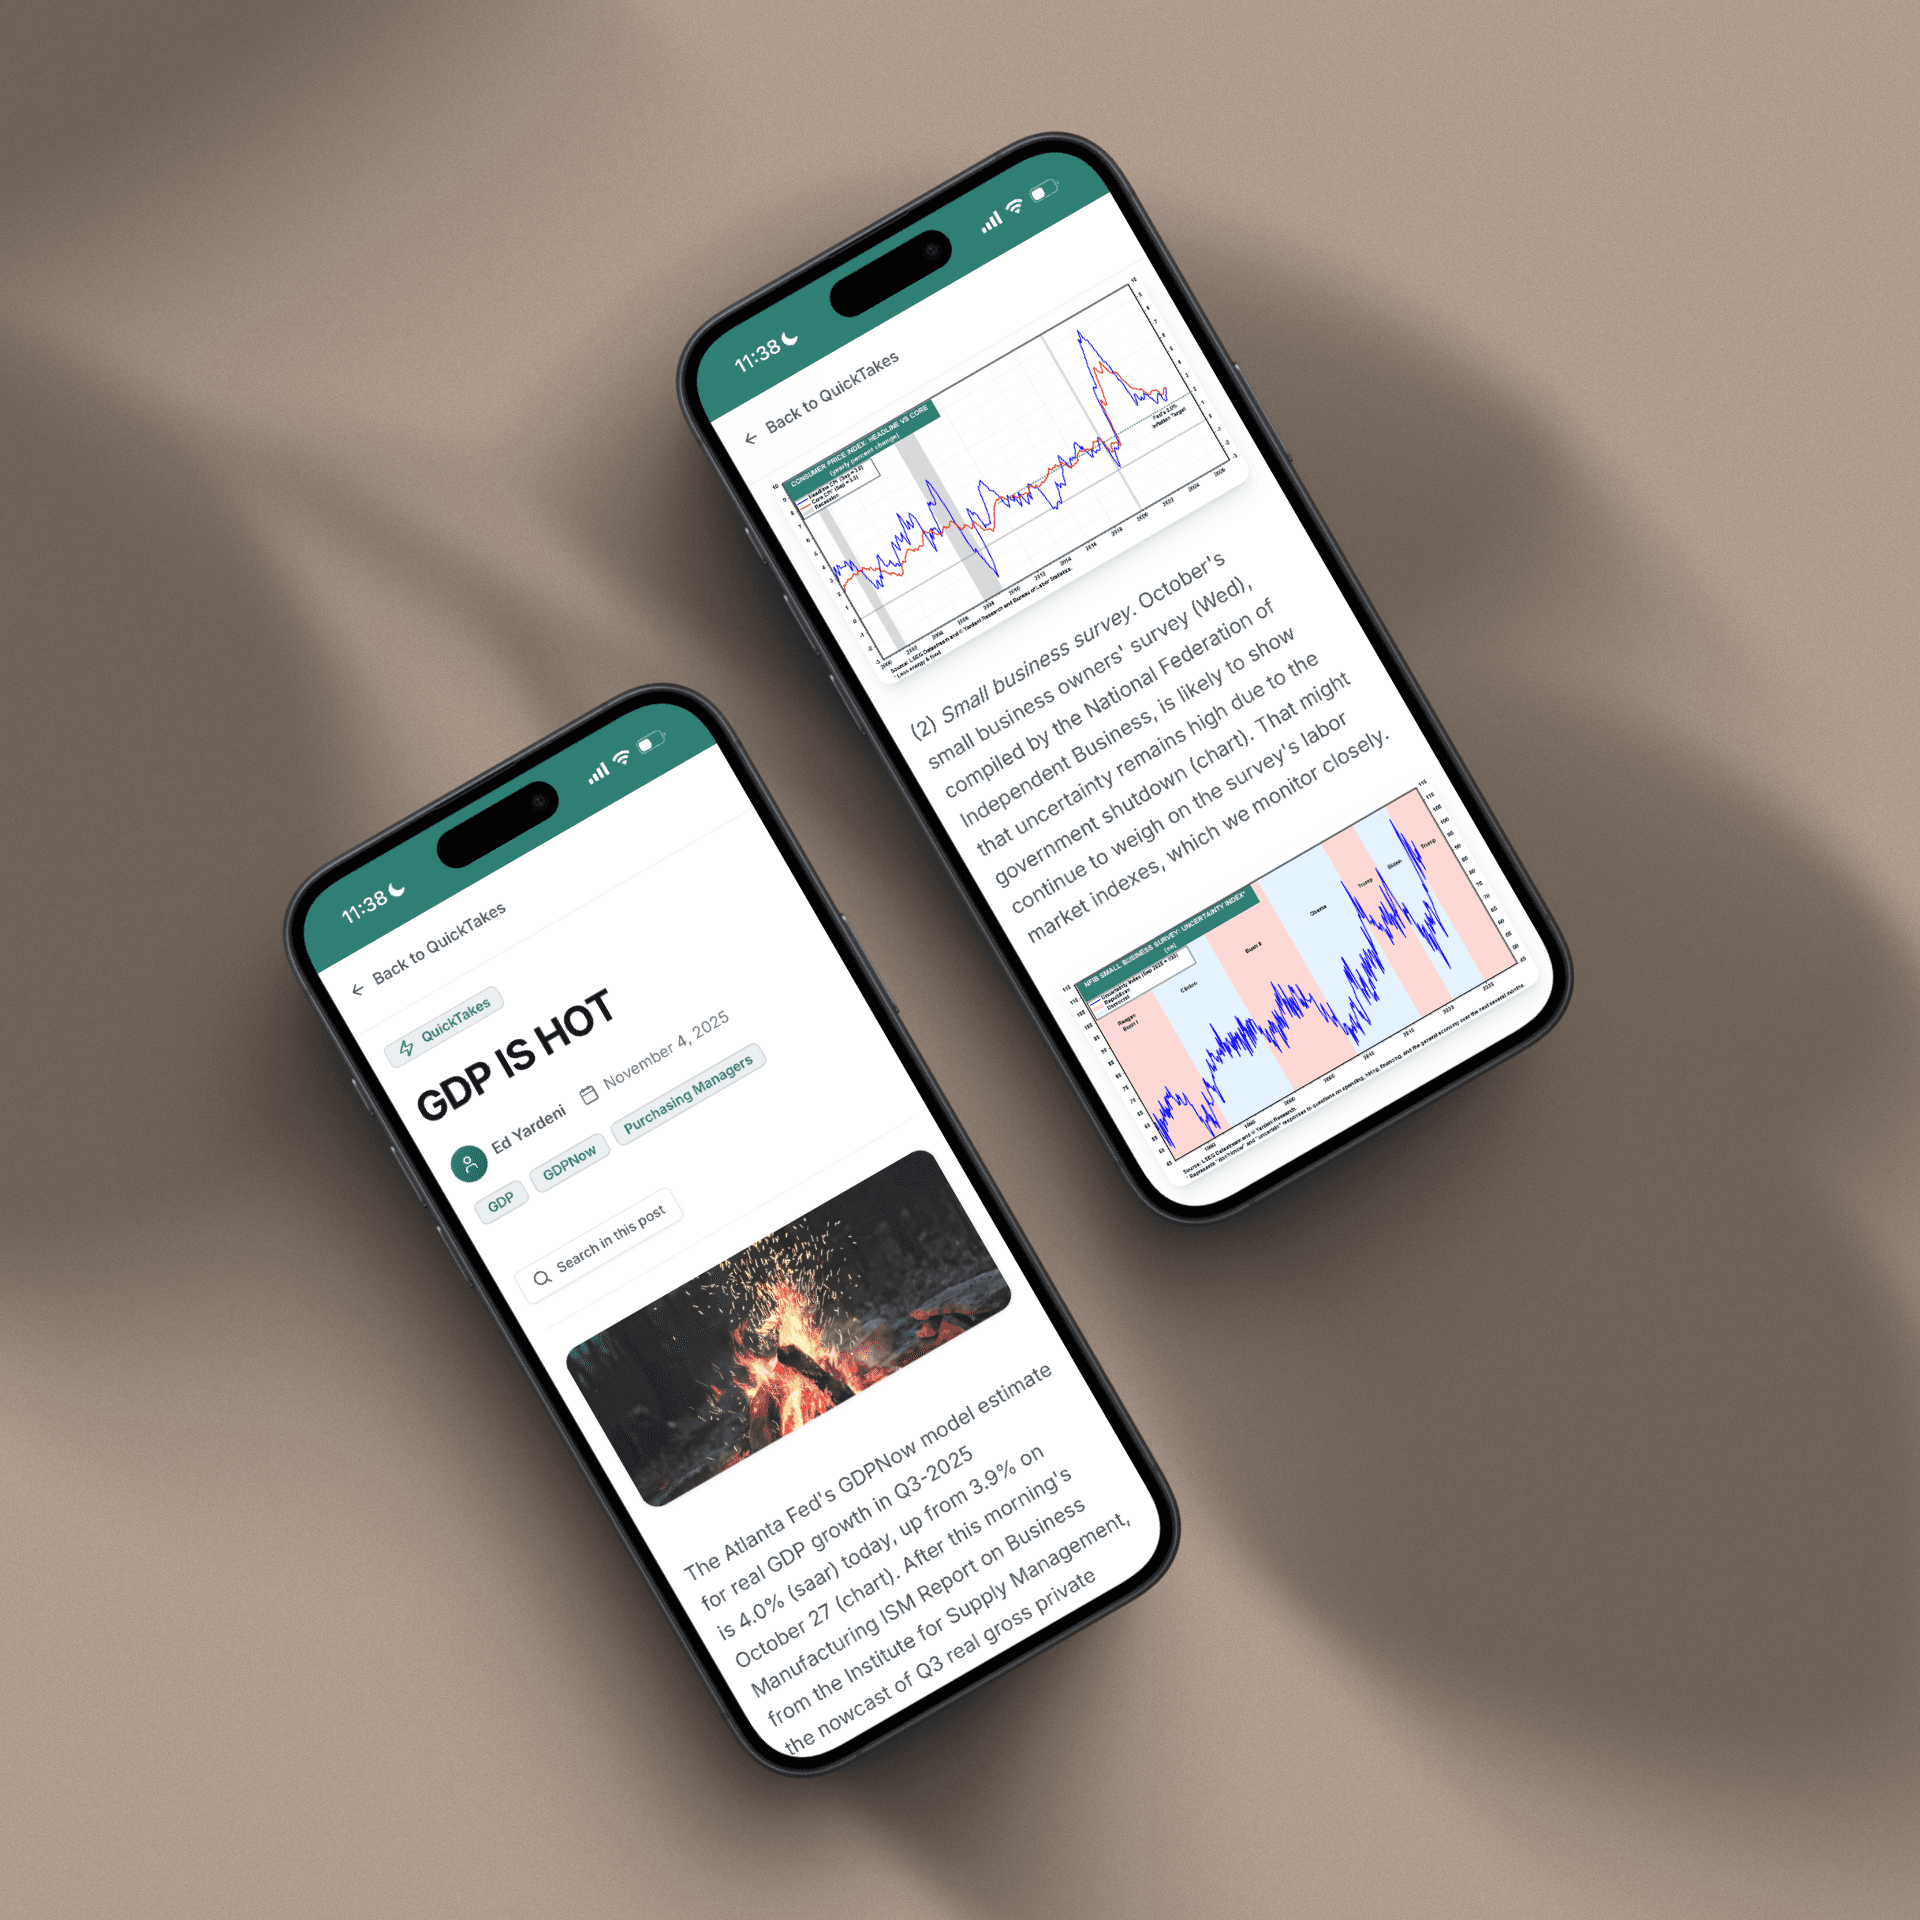
QuickTakes Topics
Timely commentary covering the most important market themes
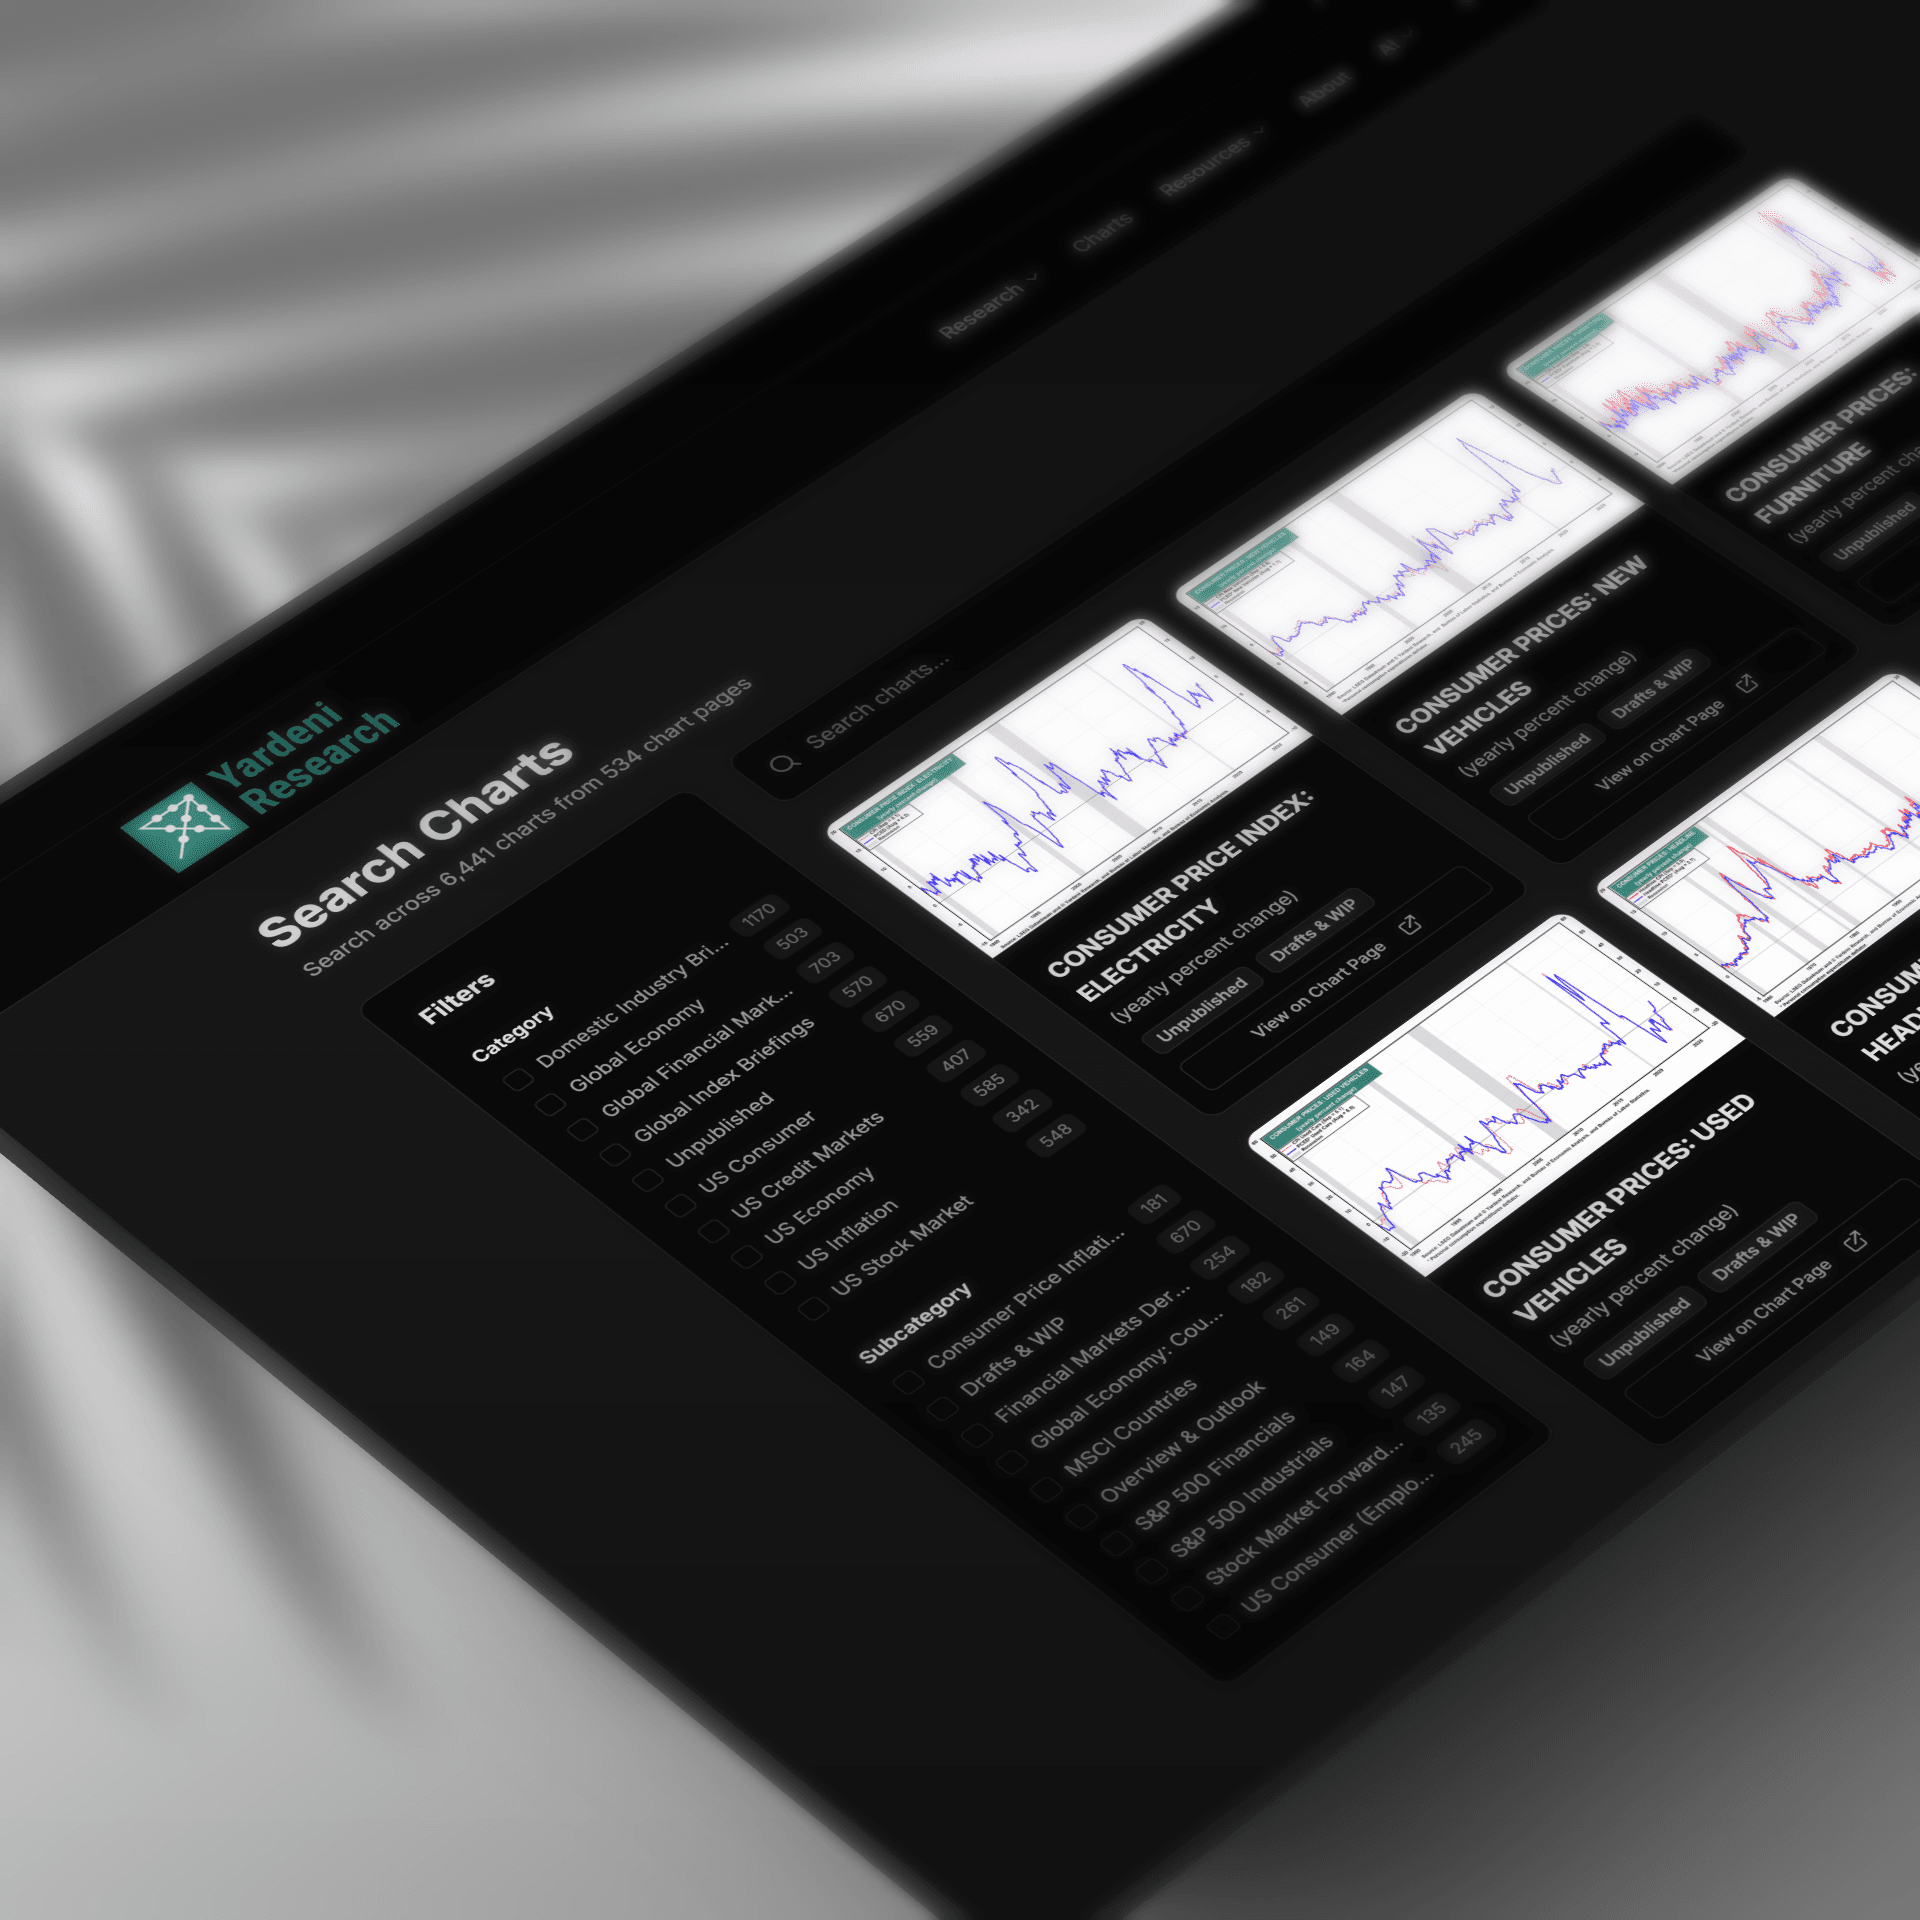
Charts
Find Any Chart in Seconds
Search across 7,404+ real-time charts with instant visual previews
WELLS FARGO: FORWARD PROFIT MARGIN
S&P 500 TRANSACTION & PAYMENT PROCESSING SERVICES: STOCK PRICE INDEX
ORACLE FORWARD P/E
COLGATE-PALMOLIVE: PRICE, FORWARD EARNINGS & VALUATION
Sample charts from our collection of 7,404+ visualizations
Tools
Research Tools
Interactive dashboards for tracking economic conditions and market trends
Beige Book Monitor
Fed economic conditions across 12 districts with traffic-light signals.
FOMC Policy Meter
Dovish-to-hawkish policy stance tracker across FOMC meetings.
FOMC Minutes Monitor
Hawk/dove signal extraction across 10 economic themes.
FOMC SEP Monitor
Fed projections and dot plot distributions across meetings.
Private Credit Monitor
Auto-updating chronology of the private credit liquidity crisis.
Release Calendar
Major publications from the Fed, ECB, IMF, and 12 global institutions.
Try Yardeni Research free for four weeks.
Full access to everything we publish. No credit card, no obligation.