Independent Financial Research & Analysis
Daily briefings, 7,400+ real-time charts, and macro insights from Dr. Ed Yardeni and his research team.
Research
Latest Research
Recent insights from our research team
On Chinese AI Competition & Poland As AI Play
Companies’ AI bills can quickly get out of control with token pricing and AI agents assigning themselves work. Increasingly, US firms are cutting ties with the likes of Claude in favor of vastly cheaper Chinese models. How much of the US AI market Chinese competitors capture could determine the fates of Claude, Gemini, and ChatGPT, Melissa says. Today, she explains the decision calculus that has corporate America rethinking how to use AI most cost effectively and where to buy it from. … Also: Poland is an unlikely Silicon Valley, but its economy is fast becoming a tech powerhouse. William discusses how Poland’s AI ambitions could be just what its economy needs.
On China’s Property Meltdown & Asia’s AI Meltup
China’s property market is spiraling again, William reports. Falling home prices and land-sale revenue are compounding three domestic headwinds: deflation, weak spending, and shaky local finances. A negative feedback loop is escalating the problems, and the government’s fixes don’t address them head on. … Also: The stock markets of South Korea and Taiwan are so concentrated in a few big AI exposed tech companies that they’ve been riding the roller coaster of investor sentiment toward AI. But Toby says they’re two of the world’s best performing stock markets ytd notwithstanding their volatility. And they’ve got the earnings growth outlooks to back their rallies up.
Warsh Taking Hawkish Path to Lower Interest Rates
Fed Chair Kevin Warsh has often said that the members of the Federal Open Mouth Committee should talk publicly less often. He wants the Fed to follow the financial markets rather than the other way around. Yet, two weeks after his first press conference as Fed chair on Wednesday, June 17, he is scheduled to appear on a policy panel on Wednesday, July 1, at the annual ECB Forum on Central Banking. Investors will be following closely what he has to say. They did the same during his presser. They heard him mention "price stability" eight times. In effect, he reiterated the final sentence of the June 17 FOMC statement: "The Committee will deliver price stability." In his prepared comments for his presser, he said, "We recognize that inflation has been running well ahead of the Fed’s long-stated inflation goal of 2 percent that’s been going on for more than five years." We anticipated that the FOMC would pivot from its easing bias to a tightening bias at the June meeting. However, we were surprised by Warsh's hawkishness. After all, President Donald Trump picked him to replace Fed Chair Jerome Powell because he publicly backed the president's call for the Fed to lower the federal funds rate (FFR). Yet the White House didn't call out Warsh for his hawkish stance during his presser. When asked for his reaction, Trump said Warsh is "fantastic" and stated, "I want him to do whatever he wants." Speaking at the Economic Club of New York on June 23, Treasury Secretary Scott Bessent responded to a question about Warsh saying, "Warsh will optimize the path for inflation and economic growth. He will be independent and do what he wants." We believe that there is a new Treasury-Federal Reserve Accord aimed at lowering the 10-year Treasury bond yield. Bessent and Warsh are working as a team. They seem to have convinced the president that the best way to lower borrowing costs is to talk tough about bringing down inflation and to hike the FFR if necessary. That should lower bond yields, stimulating the economy. Consider the following: (1) Bond Vigilantes. Easing monetary policy does not always result in lower borrowing costs. When the Fed started its latest rate-cutting cycle during September 2024, we warned that easing into a resilient economy with entrenched inflationary pressures would incite the Bond Vigilantes. It did. Since then, the policy rate has fallen 175bp, yet the 10-year Treasury yield has risen from 3.70% to 4.38% (chart). Mortgage rates also rose, following the lead of the Bond Vigilantes rather than the Fed (chart). (2) Yield Curve. Warsh's surprisingly hawkish presser pushed the 2-year Treasury note yield higher as markets priced in a rate hike, while the 10-year yield fell, flattening the yield curve (charts). This suggests that the Bond Vigilantes figure that if the Warsh Fed is going to be vigilant about inflation, they can relax. (3) Bessent's Howitzers. Bessent seems to agree that a vigilant Fed should calm the Bond Vigilantes. As he recently put it, “bond markets have taken out more governments than howitzers.” Premature rate cuts risk triggering a backlash by the Bond Vigilantes, driving the 10-year yield higher, and inadvertently raising rather than lowering borrowing costs. Bessent and Warsh are on the same page. (4) War & Peace. Before Operation Epic Fury, Brent crude traded around $72 per barrel. It is back near $72 today. The oil shock is over, barring renewed escalation of the latest Gulf War. Yet the 2-year Treasury yield, which stood at 3.35% before the conflict, remains at 4.10%, and markets are still pricing in rate hikes rather than the prewar expectations of rate cuts (chart). (5) Hot Economy. The economy is running hot, as confirmed by the latest strong readings of the Citigroup Economic Surprise Index (chart). Strong economic growth is a double-edged sword. When it is productivity-led, it is disinflationary. Unit labor cost inflation rose just 0.5% y/y in Q1-2024 (chart). That was the argument Warsh made when he was seeking the Fed chairmanship. He claimed that AI-driven productivity was boosting economic growth and lowering inflation. So he advocated lowering the FFR. But strong growth can also stoke inflation. May's PCED supercore, i.e., services excluding housing and energy, rose 3.9% y/y, the highest since September 2023 (chart). Even before the war, it remained stuck just above 3.0%. Meanwhile, the AI-building boom is causing electronic hardware prices in the CPI and PPI to soar (chart).
Archive
Our Research Library
19 years of daily research, charts, and analysis
Topics
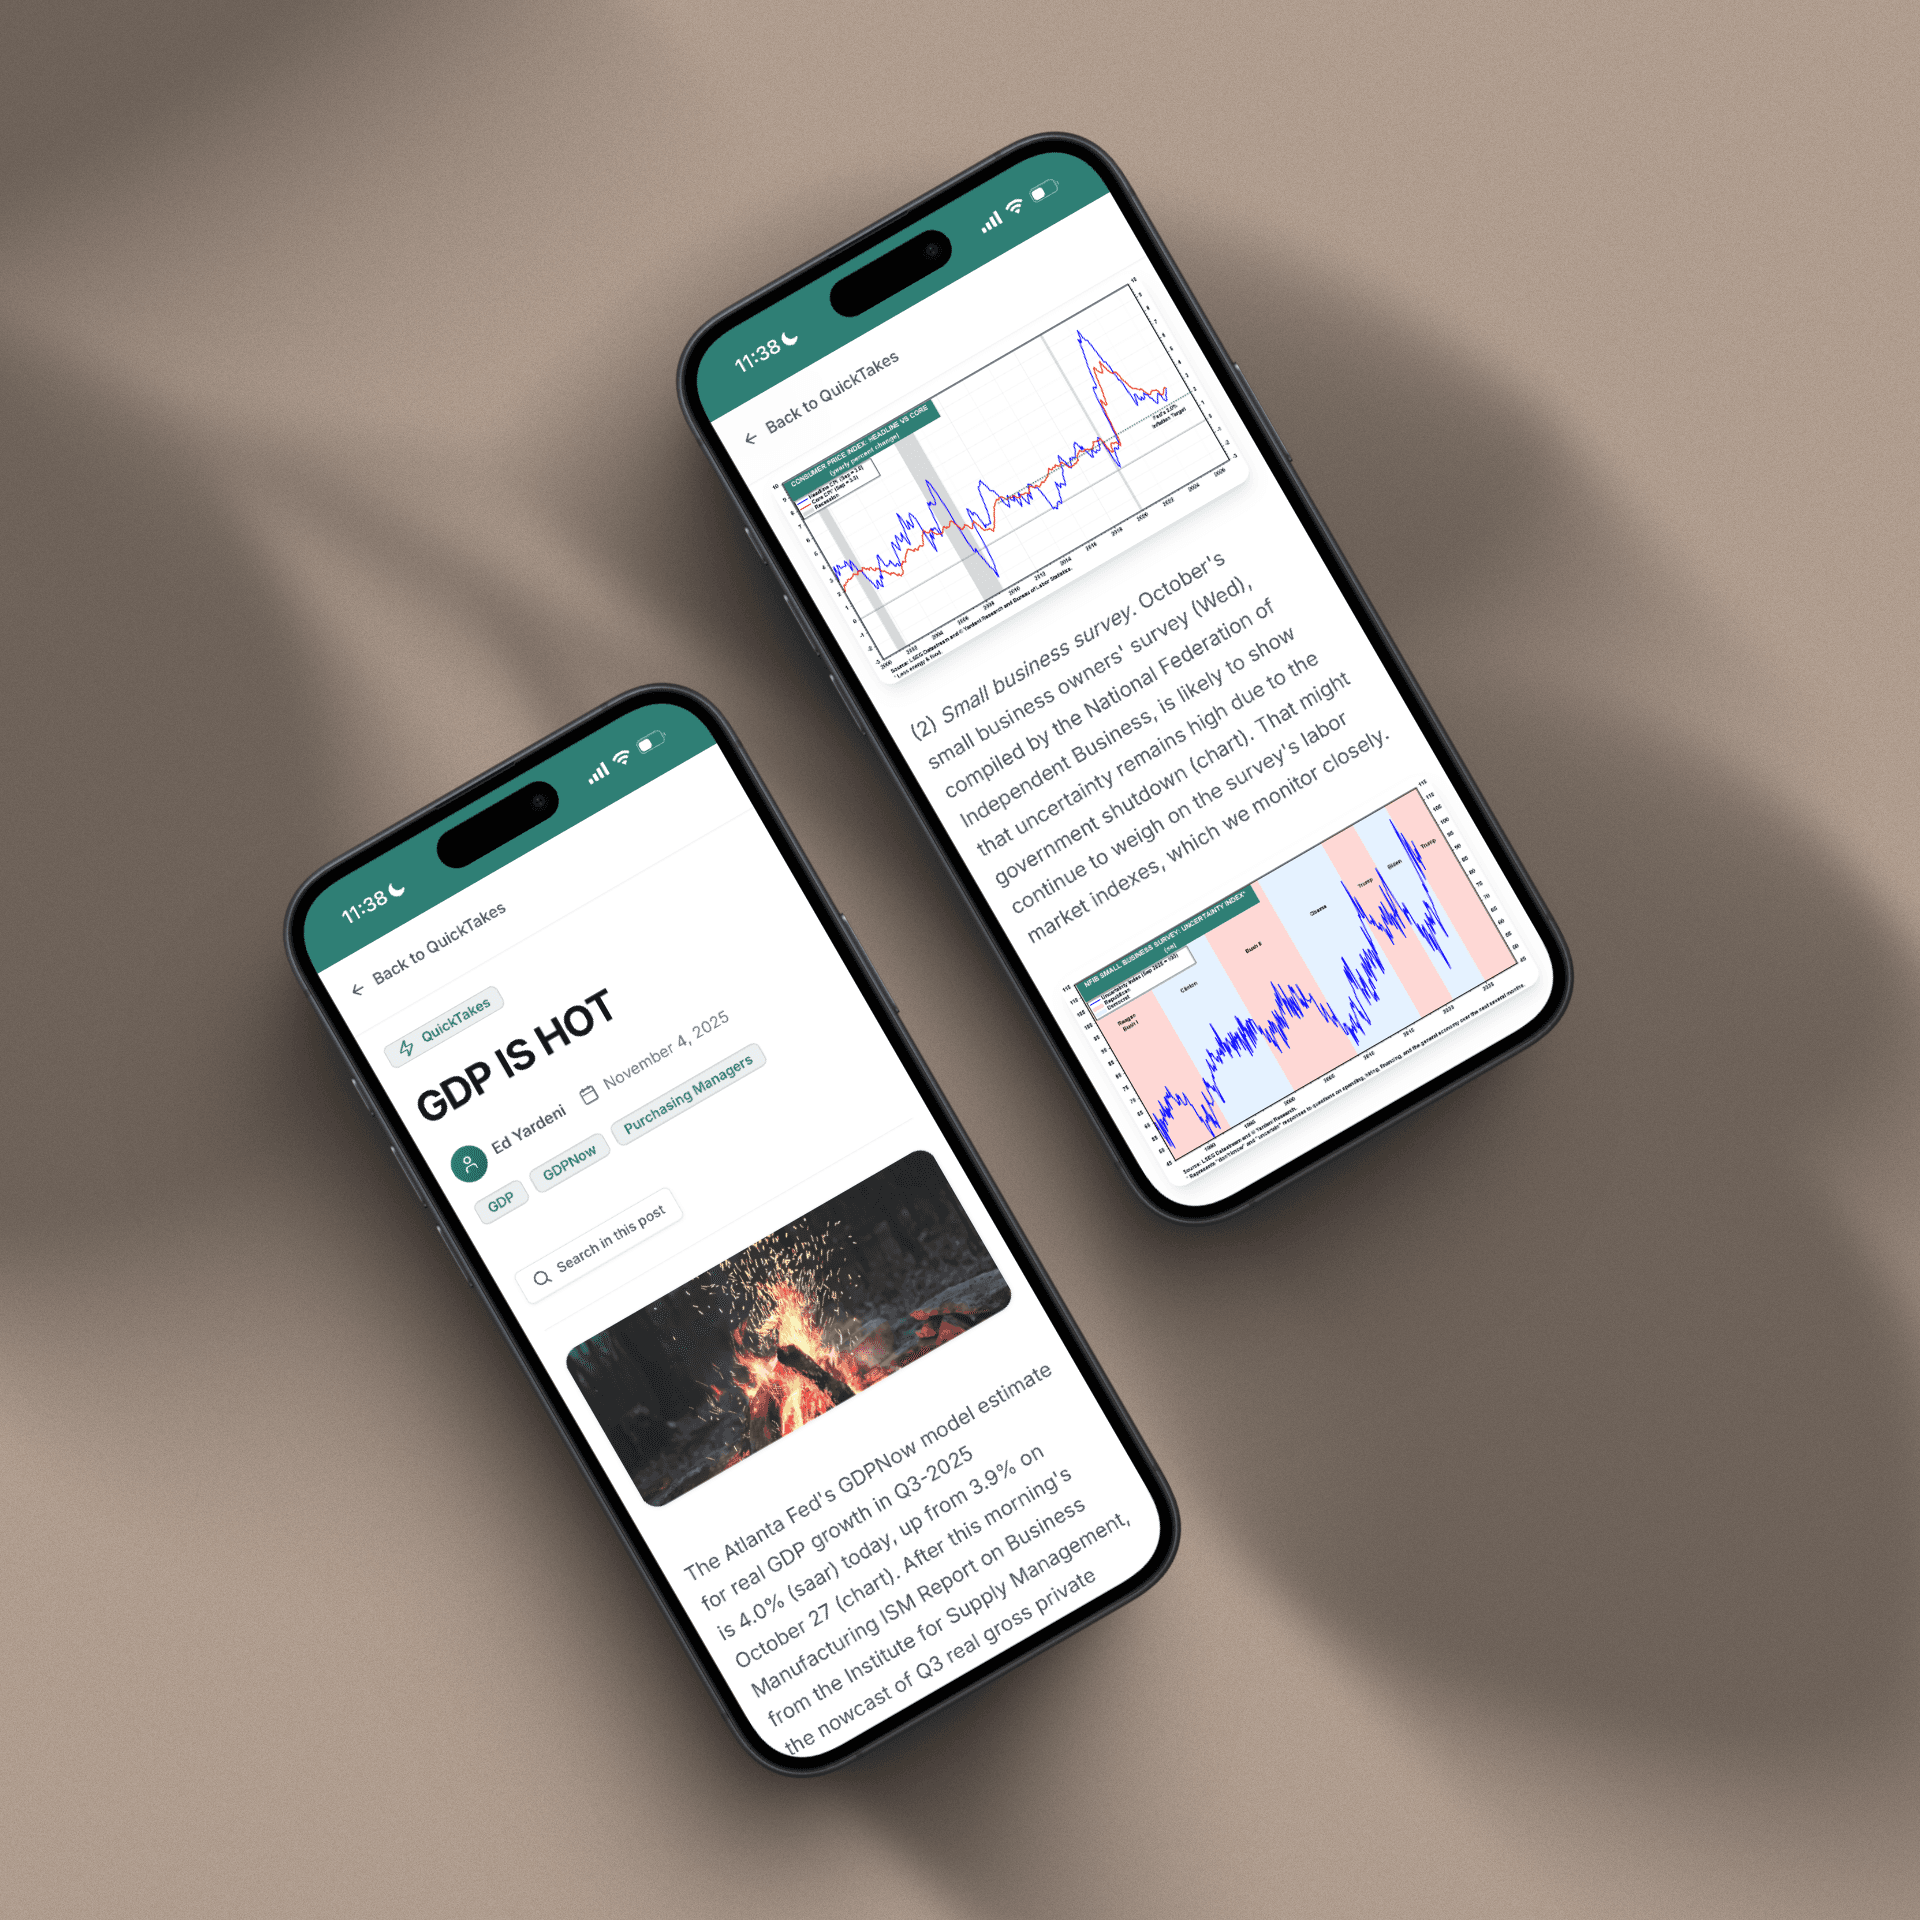
QuickTakes Topics
Timely commentary covering the most important market themes
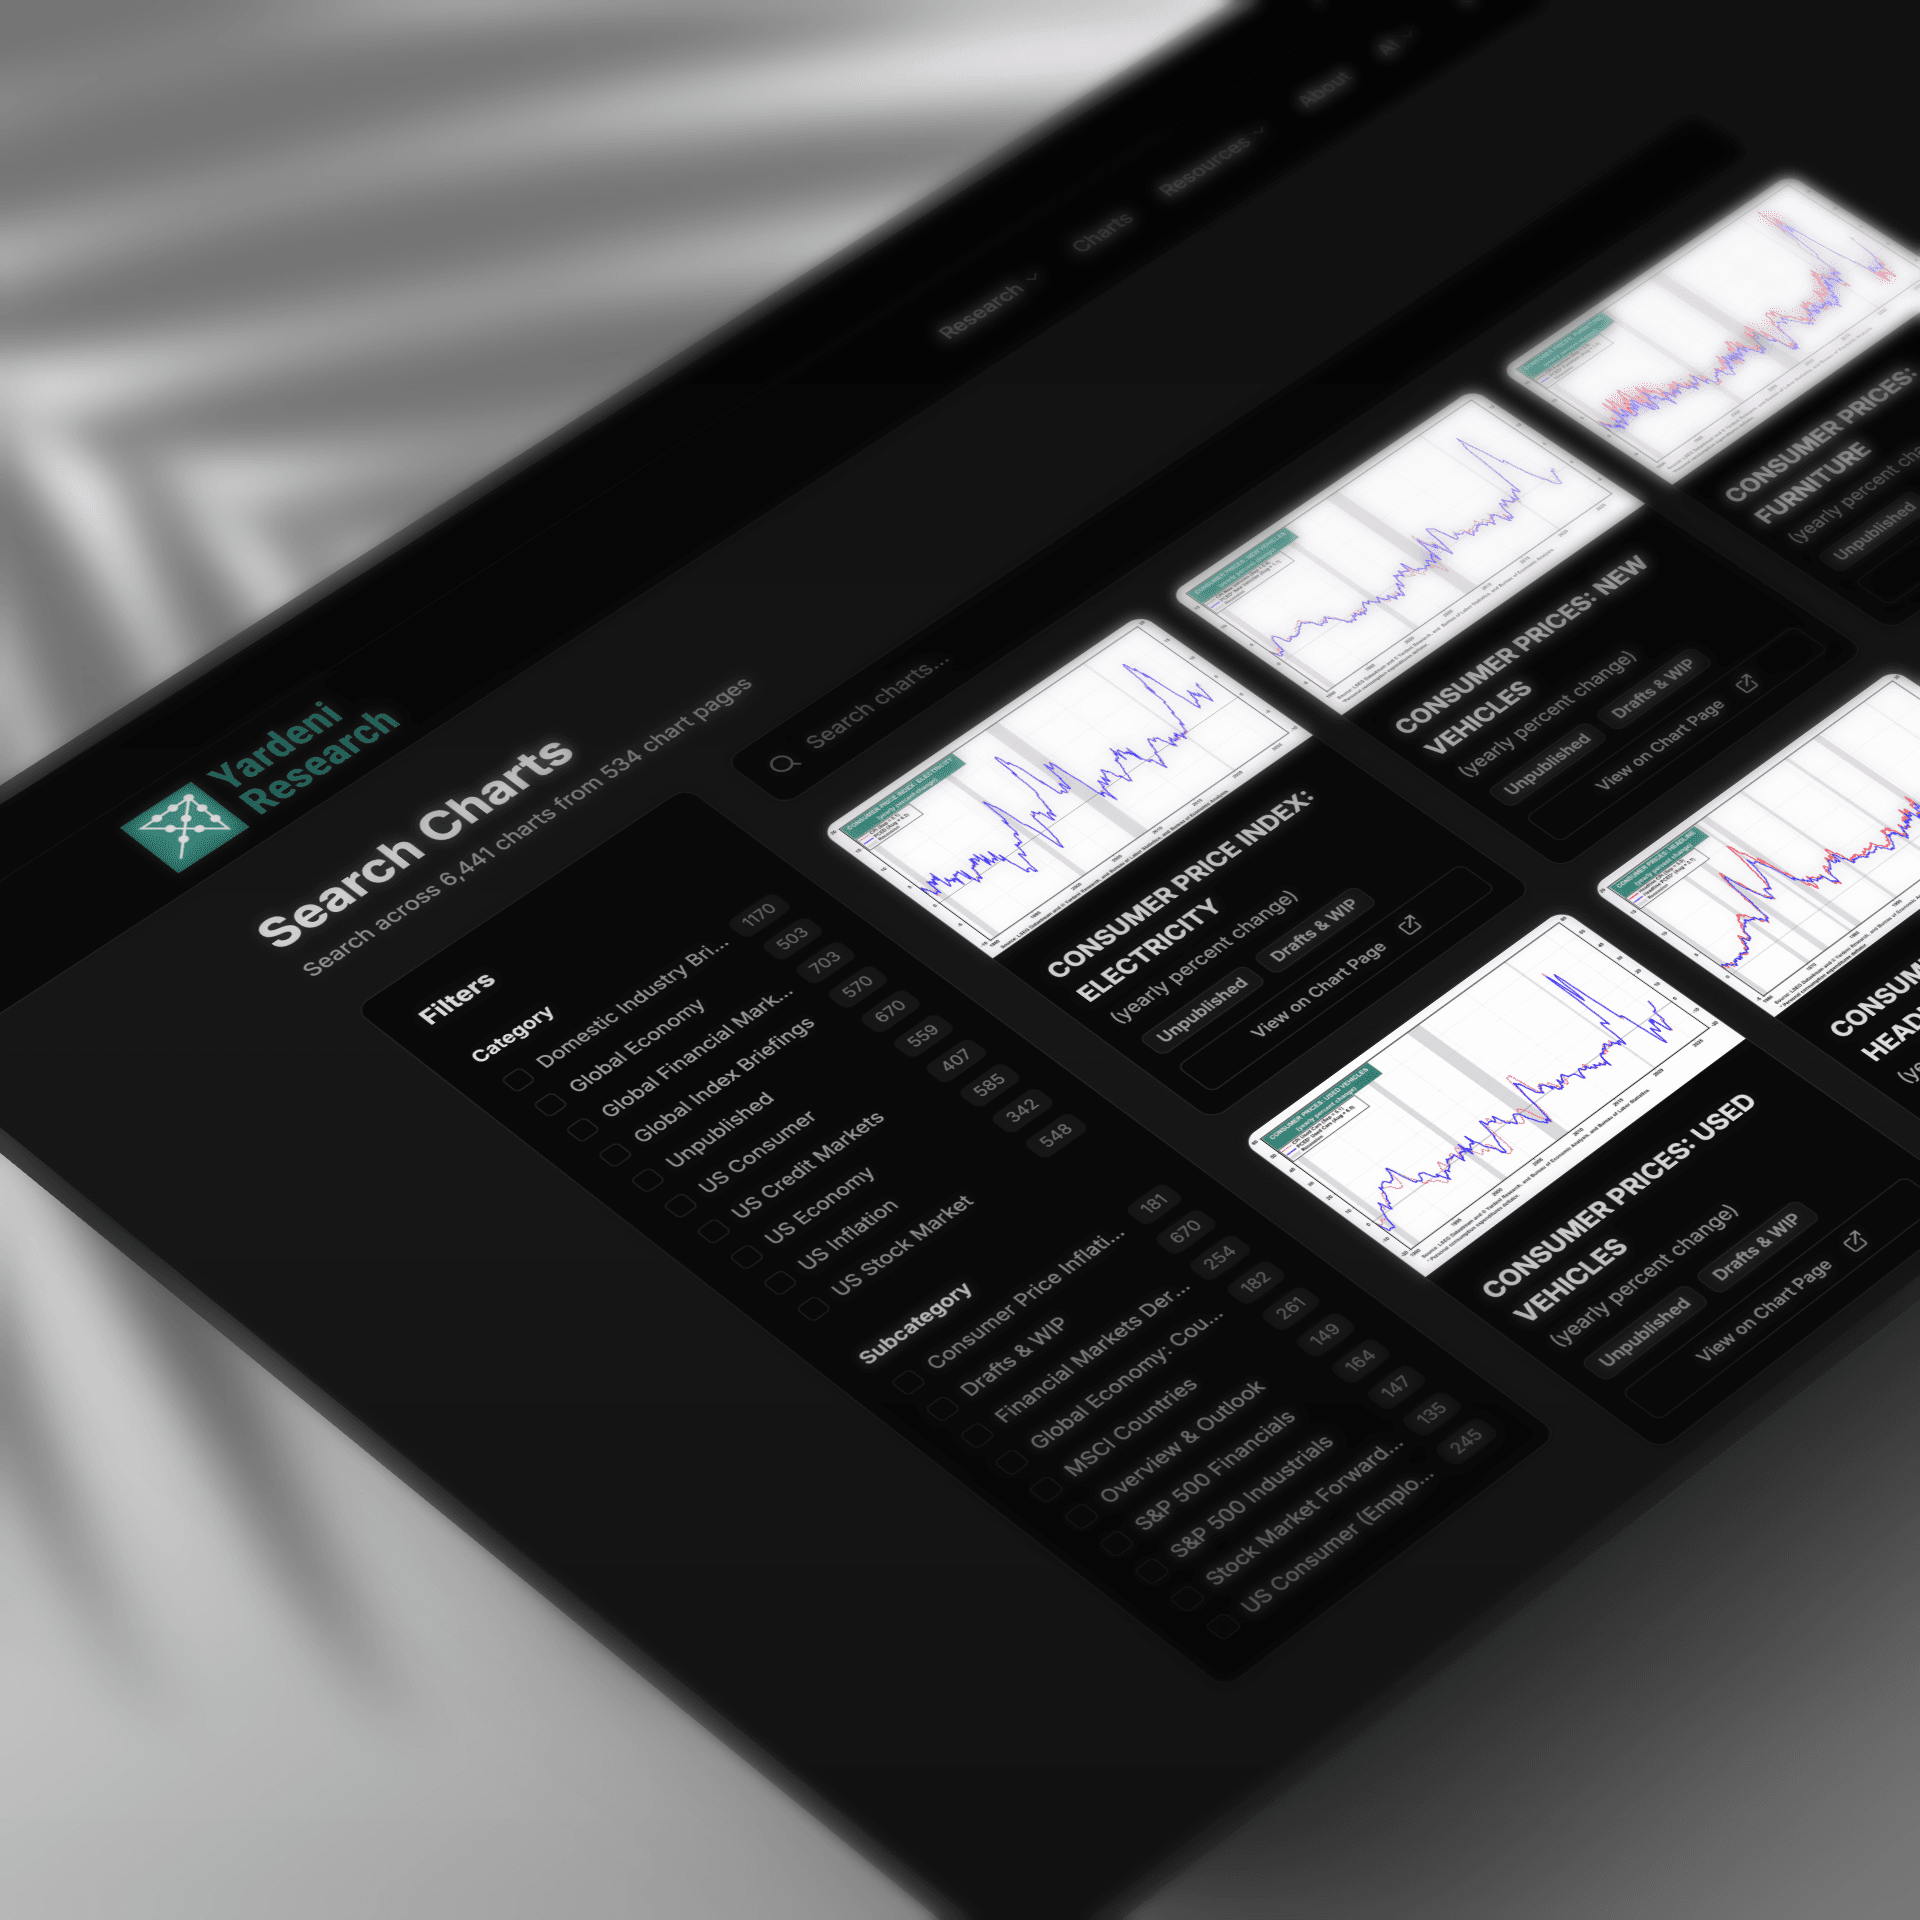
Charts
Find Any Chart in Seconds
Search across 7,432+ real-time charts with instant visual previews
BNY MELLON: PRICE, FORWARD EARNINGS & VALUATION
COLGATE-PALMOLIVE: PRICE, FORWARD EARNINGS & VALUATION
CONOCOPHILLIPS: FORWARD LTEG, STRG & STEG
LOWE'S: STOCK PRICE INDEX, EARNINGS & P/E
Sample charts from our collection of 7,432+ visualizations
Tools
Research Tools
Interactive dashboards for tracking economic conditions and market trends
Beige Book Monitor
Fed economic conditions across 12 districts with traffic-light signals.
FOMC Policy Meter
Dovish-to-hawkish policy stance tracker across FOMC meetings.
FOMC Minutes Monitor
Hawk/dove signal extraction across 10 economic themes.
FOMC SEP Monitor
Fed projections and dot plot distributions across meetings.
FOMC Statements
Every FOMC policy statement since 1997 — full text, rates, and voting records.
Private Credit Monitor
Auto-updating chronology of the private credit liquidity crisis.
Release Calendar
Major publications from the Fed, ECB, IMF, and 12 global institutions.
Try Yardeni Research free for four weeks.
Full access to everything we publish. No credit card, no obligation.