Independent Financial Research & Analysis
Daily briefings, 7,300+ real-time charts, and macro insights from Dr. Ed Yardeni and his research team.
Research
Latest Research
Recent insights from our research team
Bond Vigilantes Welcome New Fed Chair Warsh With Loud Bronx Cheer
The financial markets expect interest rates to remain higher for longer, notwithstanding President Trump’s demands that Kevin Warsh, newly instated as Fed chief, get rates down. But the macroeconomic backdrop no longer supports an easing bias, let alone a rate cut. Paradoxically, Elias and Ed explain, a more hawkish Warsh than investors expect would actually work in Trump’s favor via its downward effect on long-term Treasury yields. … We expect the Fed to hold rates unchanged at its June meeting, shifting to a tightening policy stance, followed by a rate hike in July. … Also: Two recent Fed reports confirm consumers’ resilience.
MARKET CALL: Time for A Break Or a Brake?
The S&P 500 sold off by 1.2% on Friday after hitting a record high of 7501.24 on Thursday. We are sticking with our 8250 year-end target for the S&P 500 (chart). However, the index might have peaked for a while. That's because bond yields spiked on Friday, which just happened to be Kevin Warsh's first day at the office as the new Fed chair. The bond market fears that he will tolerate inflation rather than hike the federal funds rate (FFR). He will likely have to cave and join the tightening camp sooner rather than later. The Bond Vigilantes will force him to pivot. So will his colleagues on the FOMC. The Strait of Hormuz remains closed. In a post on Truth Social, President Donald Trump warned: "For Iran, the Clock is Ticking, and they better get moving, FAST, or there won’t be anything left of them. TIME IS OF THE ESSENCE!" A drone strike caused a fire at a nuclear power plant in the United Arab Emirates, officials there said on Sunday, while Saudi Arabia reported intercepting three drones. Brent crude is up $2 to $111 per barrel this evening (chart). The longer it remains here or higher, the greater is the likelihood that the Fed will have to pivot from its easing bias in April to a tightening bias in June and an actual rate hike in July. We wouldn't rule out a June rate hike. Last Wednesday, when the 10-year US Treasury yield was 4.46%, we predicted it was "likely to move up to 4.60% in the coming days." It got there on Friday (chart). This evening, it is at 4.63%. If it moves higher from here, then we would expect it to peak between 4.75% and 5.00% in the coming weeks. That would be a good buying opportunity for both bonds and stocks. The S&P 500 forward P/E has risen 10% from its recent low of 19.1 to 21.1 on Friday, while the 10-year yield has climbed 63 bps from its low of 3.96% earlier this year (chart). If yields continue climbing, stocks will likely experience another P/E-led pullback. We would view it as another buying opportunity. The S&P 500 market-weighted index is more vulnerable to a pullback than is the equal-weighted index (chart). That's because it is more stretched relative to its 200-day moving average. The consensus expectations among analysts for S&P 500 long-term earnings growth is 21.2%, well above the historical average of 12.7% (chart). That reflects mounting excitement about the AI revolution. The question is whether this exuberance is rational or irrational. There could be another sell-off in AI-related stocks, triggered by DeepSeek, which just introduced an ultra-cheap LLM workhorse optimized for speed, agent infrastructure, and background tasks. The S&P 500's forward EPS rose to a record $355.99 last week (chart). The 2026 and 2027 consensus estimates have rocketed higher in recent weeks. The earnings-led meltup since March 31 has been driven by genuine fundamental strength, not multiple expansion. We have never seen quarterly consensus earnings expectations rise this quickly at this stage of an earnings cycle (chart). Earnings breadth continues to widen, with 85.6% of S&P 500 companies showing positive 12-month changes in forward earnings and 89.4% in forward revenues (chart). LargeCap, MidCap, and SmallCap forward EPS are all still rising to record highs(chart). The Magnificent-7 have outperformed the Impressive-493 since March 30 (chart). We think the latter might outperform the former for a while. Despite the record high in the S&P 500 last week, the Investors Intelligence bull/bear ratio is 2.24, below its 2.60 long-term average. The AAII ratio is 1.07, below its 1.19 average. Both remain well below the levels that preceded major pullbacks in the past (chart). We recommended Go Global on December 7, 2025. Stay Home has outperformed since March 30 (chart). It might continue to do so the longer that the Strait remains blockaded. Gold is pulling back from its highs near $5,500 earlier this year, and trading at $4,537 this evening (chart). The retreat makes sense. Rising yields and a firming dollar are headwinds for bullion in the short term. The long-term structural bull case remains intact. We are now targeting $5,500 by year-end and still $10,000 by the end of 2029. With the Q1-2026 earnings reporting season largely over, the near-term catalyst calendar is light for the stock market, aside from Nvidia's report on Wednesday. Yields are elevated, oil prices are elevated, and the market is stretched. Sideways may be the path for the next few weeks. A small pullback would not surprise us. That is not a reason to abandon our year-end target of 8,250. Earnings breadth is improving. If the Mag-7 stalls from here, the Impressive-493 can support the index. The bull case is intact, in our opinion.
ECONOMIC WEEK AHEAD: May 18-22
On Friday, the S&P 500 fell 1.2% from its record high of 7501.24 on Thursday. A run of hot inflation data and a spike in bond yields did the damage on Friday. April headline CPI hit 3.8% y/y, the highest since May 2023, while core CPI was 2.8%. The big shocker was last Wednesday's April PPI for final demand, which rose 6.0% y/y, the biggest increase since December 2022 (chart). Federal funds futures have fully reversed the Fed's easing path priced just three months ago, with the next move now expected to be a hike. The 2-year Treasury yield rose to 4.08% on Friday, confirming that the current federal funds rate (FFR) range of 3.50%-3.75% is too low. The 10-year Treasury yield jumped to 4.60%, and the 30-year topped 5.10%, the highest since May 2025. As we signaled last week, we expect the FOMC to signal a tightening bias at the June meeting of the monetary policy-setting committee, followed by a 25bps FFR hike at the July meeting. We can't rule out more rate hikes over the rest of this year. The Trump-Xi summit in Beijing produced verbal alignment on keeping the Strait of Hormuz open and barring Iran from nuclear weapons, but no comprehensive tariff deal emerged. We expect that Trump might signal his next move in the Gulf War in the coming days. Odds are he will maintain the blockade of Iran's ports. The week ahead is very light on US data. April's FOMC minutes will be released on Wednesday, with a couple of regional business surveys on Thursday. NVIDIA will report on Wednesday. The UK and Eurozone CPI will be reported on Wednesday. With that said, here are the key releases most likely to shape investors' thinking this week: (1) FOMC minutes. Wednesday brings the minutes from the April FOMC meeting, when the Fed kept rates on hold for the third consecutive meeting. The headline was the dissent: As usual, Stephen Miran voted for a cut; but three officials objected to including an easing bias in the policy statement, arguing that the data no longer justify signaling that the next move would be a cut. The minutes will indicate how many other participants might have also leaned toward either a neutral or hawkish bias. In the past few weeks, Fed funds futures have flipped from pricing in cuts to pricing in one hike over the next 12 months (chart). With inflation now running too hot, the easing-bias language is the most dovish element of current Fed communication. It is unlikely to survive June’s FOMC meeting. The bias is likely to flip straight from dovish to hawkish. (2) Unemployment. Initial jobless claims (Thu) rose to 211,000, with the four-week moving average at 203,800 (chart). Continuing claims came in at 1,782,000, with the four-week moving average at 1,786,000. Until claims break decisively higher, the case for Fed rate hikes should build. (3) Global yields. Yields have surged across developed markets in recent weeks (chart). UK 10-year gilts at 5.18% lead the G7, with Australia at 5.07% and the US at 4.60% (chart). Japan, at 2.72%, has climbed from essentially zero in 2021. Monday brings Japan's Q1-2025 GDP, and Thursday brings Japan's core CPI. Wednesday is jam-packed with bond-moving data. April's UK CPI lands in the morning, followed by the German 10-year bund auction and the US 20-year Treasury auction in the afternoon. A weaker UK CPI would take pressure off the entire complex. A hot print would extend the move higher. BoE members Mann and Greene speak on Monday, with Mann the most hawkish dissenter on the MPC. (4) Business Surveys. Thursday's S&P Global flash PMIs for May are the first hard read on the month's economic activity. According to the ISM surveys, April manufacturing came in at 54.5, the strongest in over a year, while non-manufacturing slipped to 51.0. May's Philadelphia and Kansas City Fed regional business surveys will also be released on Thursday. The NY Fed survey was very strong for May (chart).
Archive
Our Research Library
19 years of daily research, charts, and analysis
Topics
QuickTakes Topics
Timely commentary covering the most important market themes
Charts
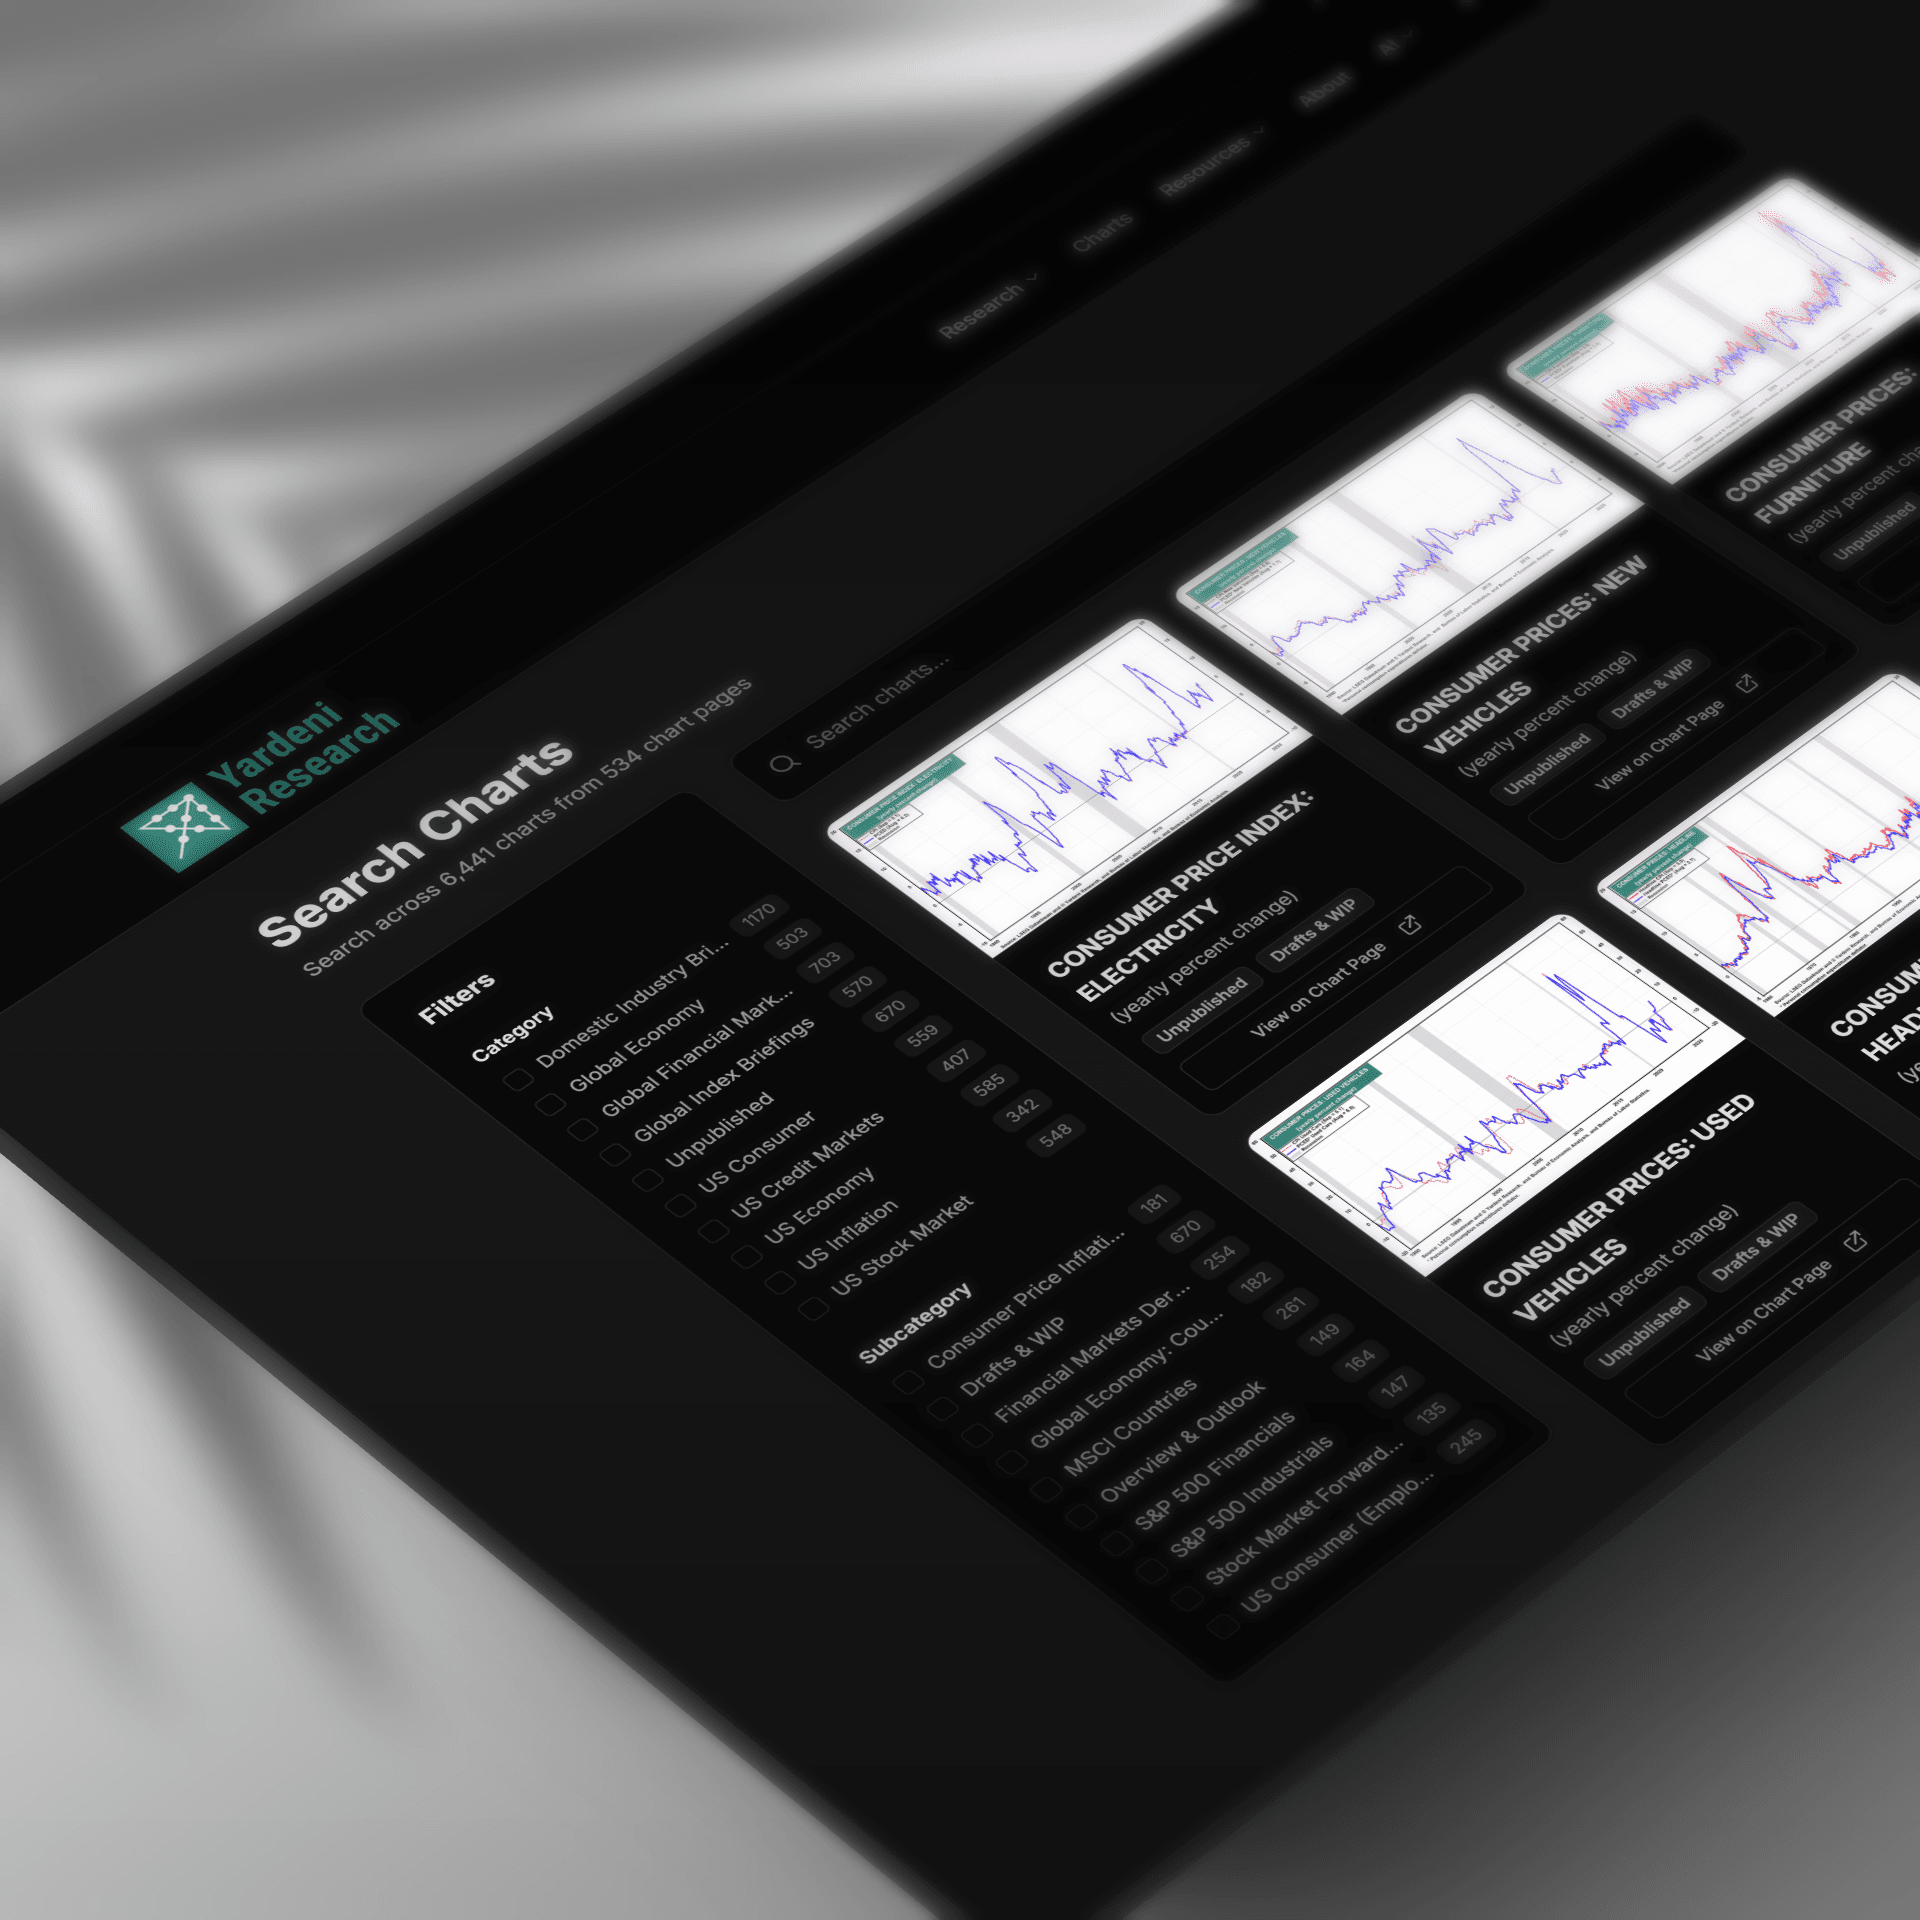
Find Any Chart in Seconds
Search across 7,339+ real-time charts with instant visual previews
TARGET: FORWARD OPERATING EARNINGS PER SHARE
TARGET: STOCK PRICE (TGT)
PHILIP MORRIS INTERNATIONAL: FORWARD P/E
COSTCO WHOLESALE: FORWARD PROFIT MARGIN
Sample charts from our collection of 7,339+ visualizations
Tools
Research Tools
Interactive dashboards for tracking economic conditions and market trends
Beige Book Monitor
Fed economic conditions across 12 districts with traffic-light signals.
FOMC Policy Meter
Dovish-to-hawkish policy stance tracker across FOMC meetings.
FOMC Minutes Monitor
Hawk/dove signal extraction across 10 economic themes.
FOMC SEP Monitor
Fed projections and dot plot distributions across meetings.
Private Credit Monitor
Auto-updating chronology of the private credit liquidity crisis.
Release Calendar
Major publications from the Fed, ECB, IMF, and 12 global institutions.
Try Yardeni Research free for four weeks.
Full access to everything we publish. No credit card, no obligation.